



UK equities trade at their widest valuation discount to developed-market peers in decades. We believe the tide is already turning, and highlight the stocks best positioned to benefit from this shift.
With the UK macro backdrop central to the thesis, this piece was developed in collaboration with AP Research, an independent UK-based research publication focused on macroeconomics. Having published research on their home market for years, they bring extensive knowledge of the local economy and markets.
We also include our discussion with ARM Holdings (NASDAQ: ARM), one of the UK’s largest companies and a global leader in semiconductors.
UK equities lack the AI exposure that has driven valuations in the S&P 500, which has clearly contributed to the valuation gap. But there is more to the story, including shifting investor sentiment, domestic capital reform, and a sector mix that could be better suited to the next cycle.
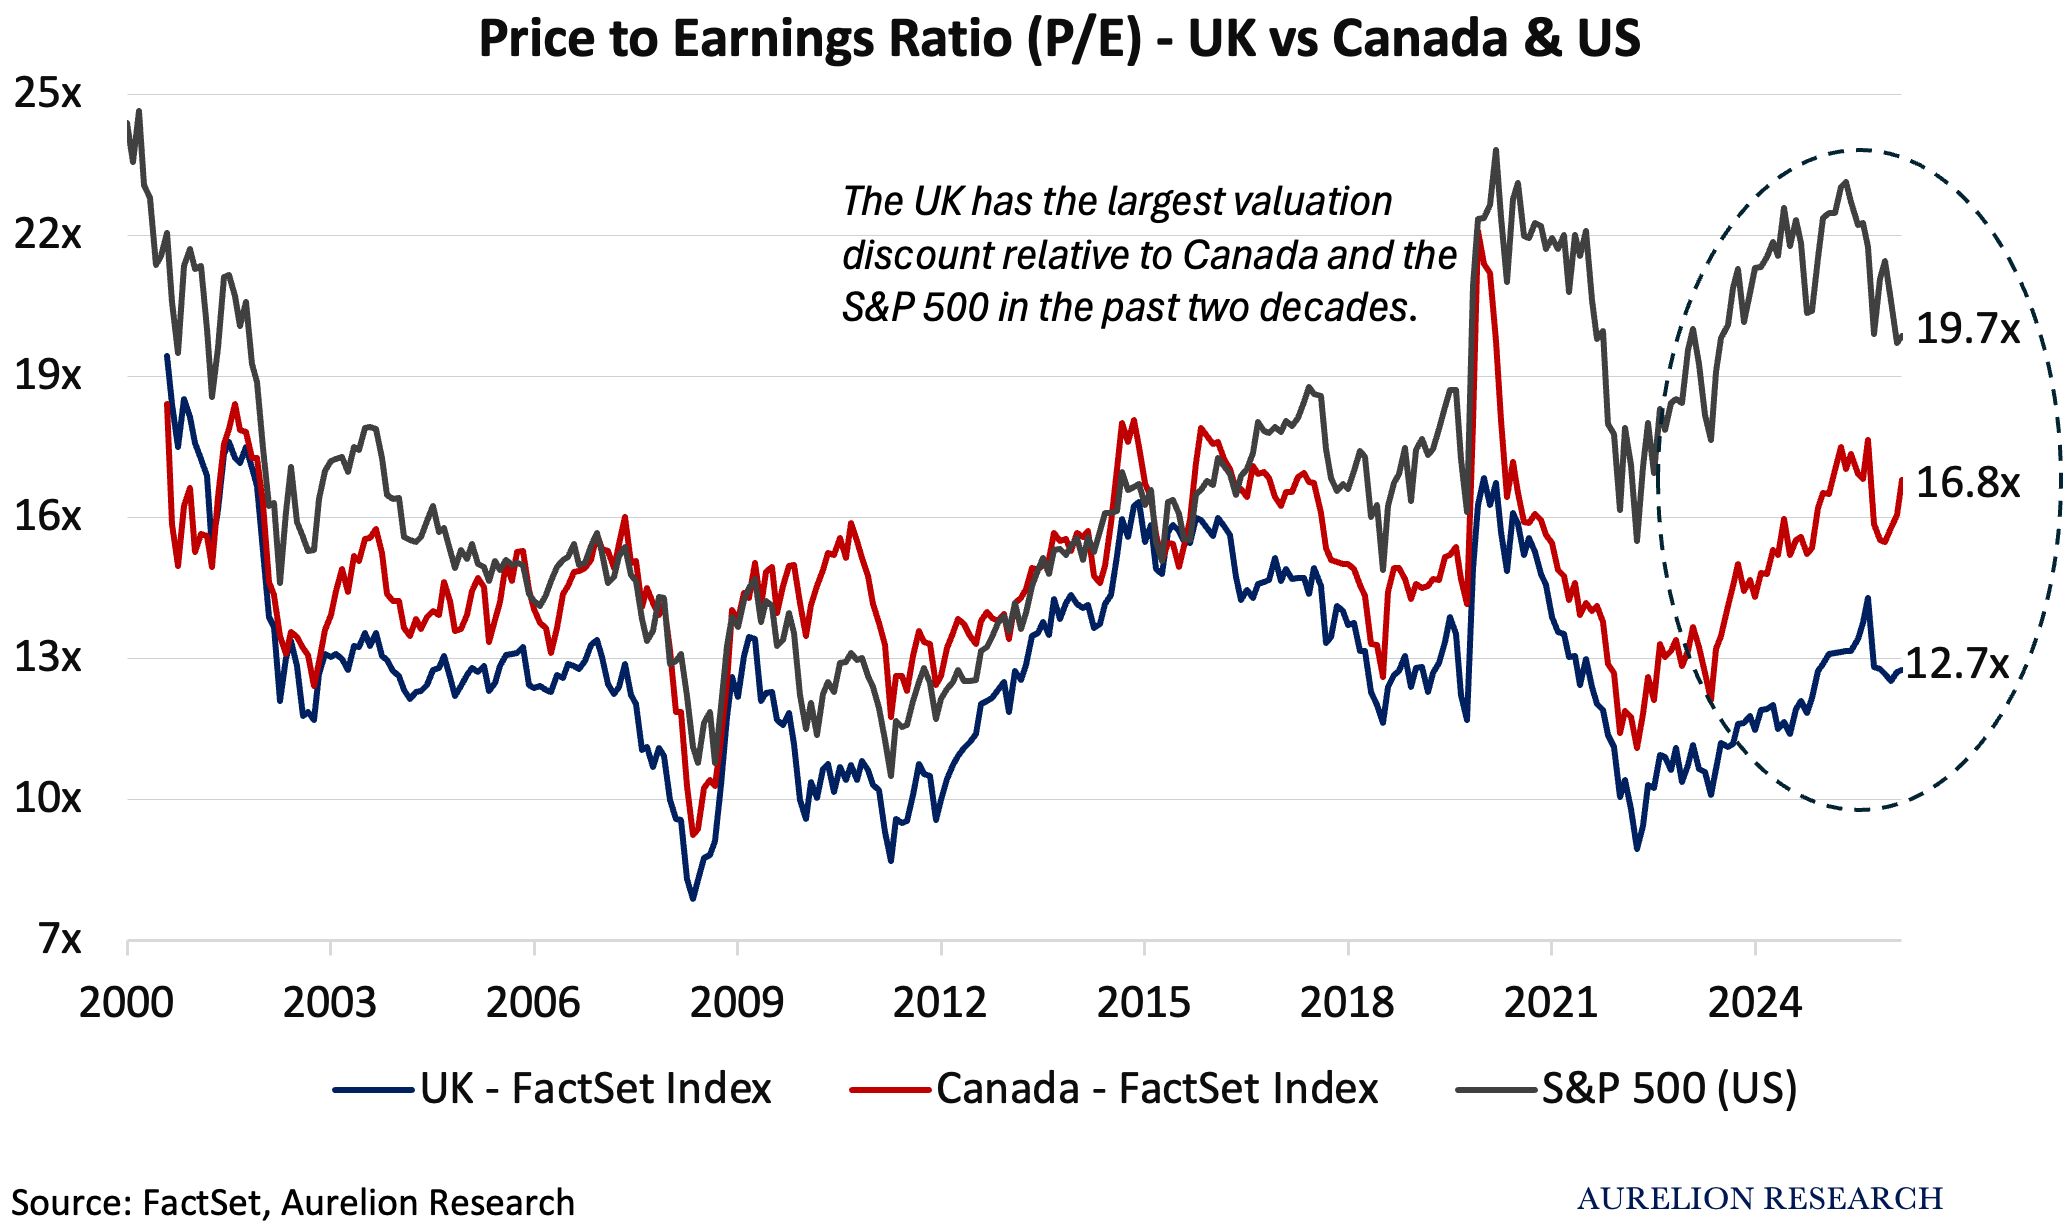
Table of Contents
The State of the UK Market
Why We Are Bullish on the UK
Growth Driver 1: Legacy Investor Ignorance
Growth Driver 2: Political Capital
Growth Driver 3: Index Composition For The Next Cycle
5.1 Financials
5.2 Energy & Materials
5.3 Healthcare
In Conversation: Arm Holdings
UK Equities: Pool of Ideas
Key Risks
Concluding Thoughts
1. The State of the UK Market
Over the past decade, UK assets have significantly underperformed their global peers. The clearest example is the FTSE 100, the UK’s flagship stock index, which has gained 62% over this period, compared with a 254% gain for the S&P 500.
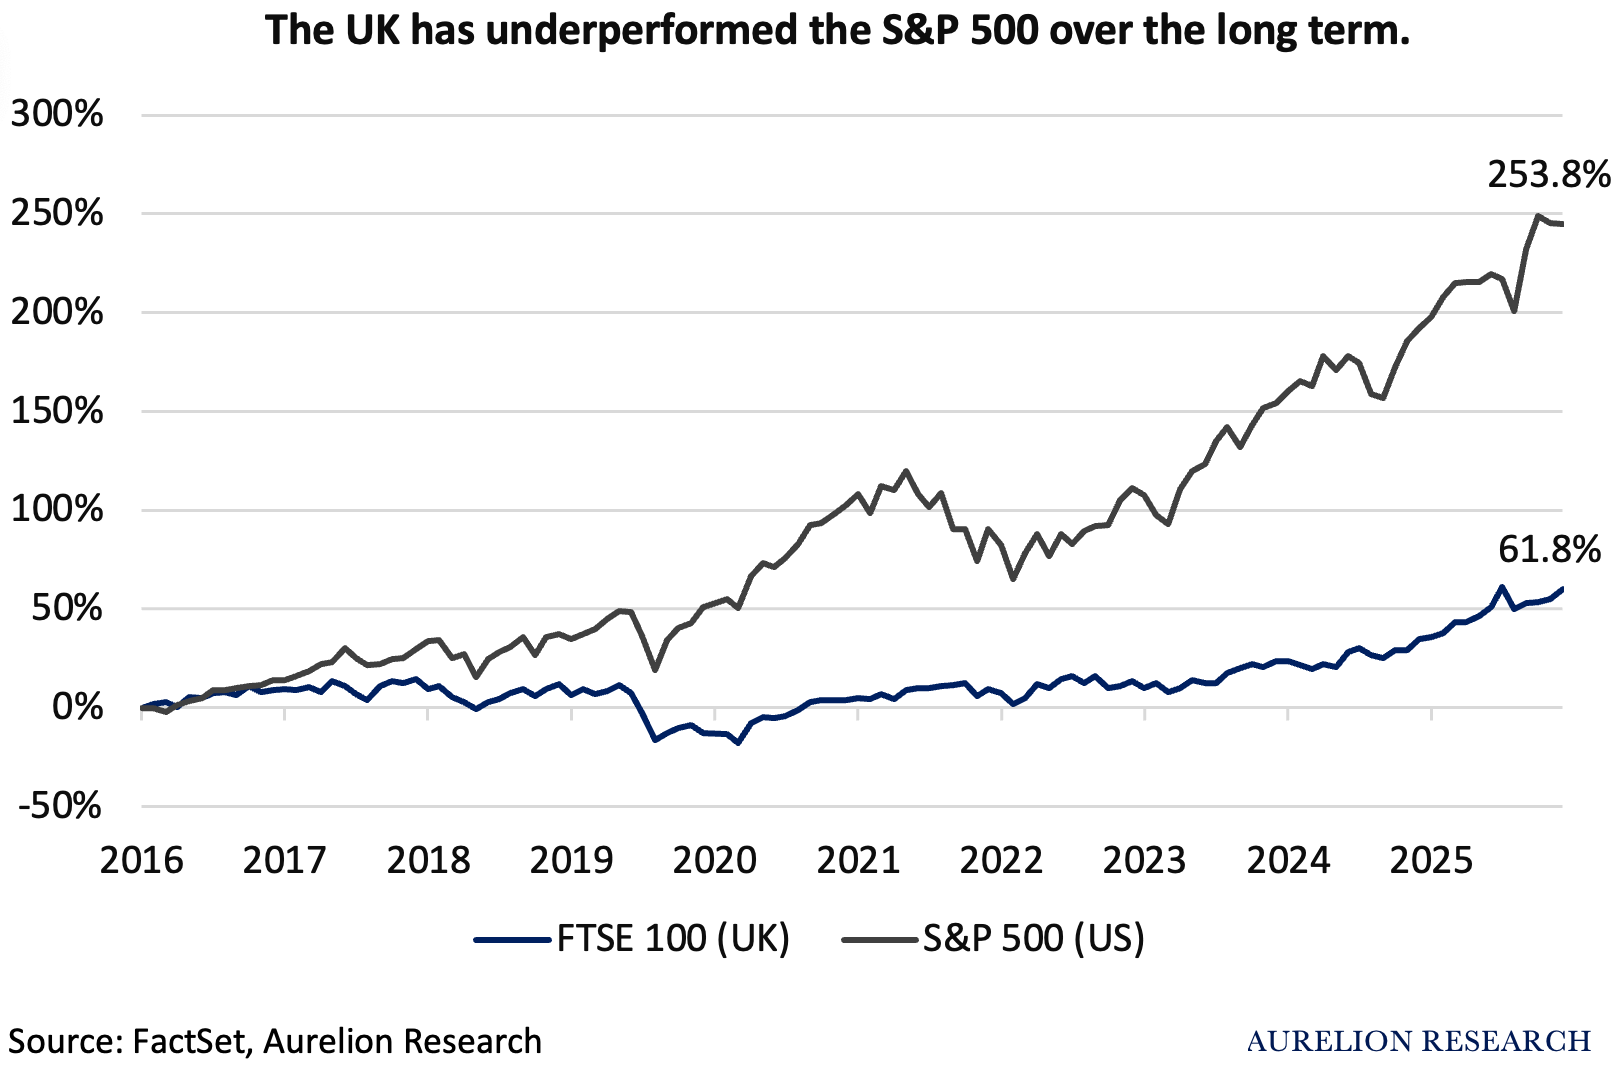
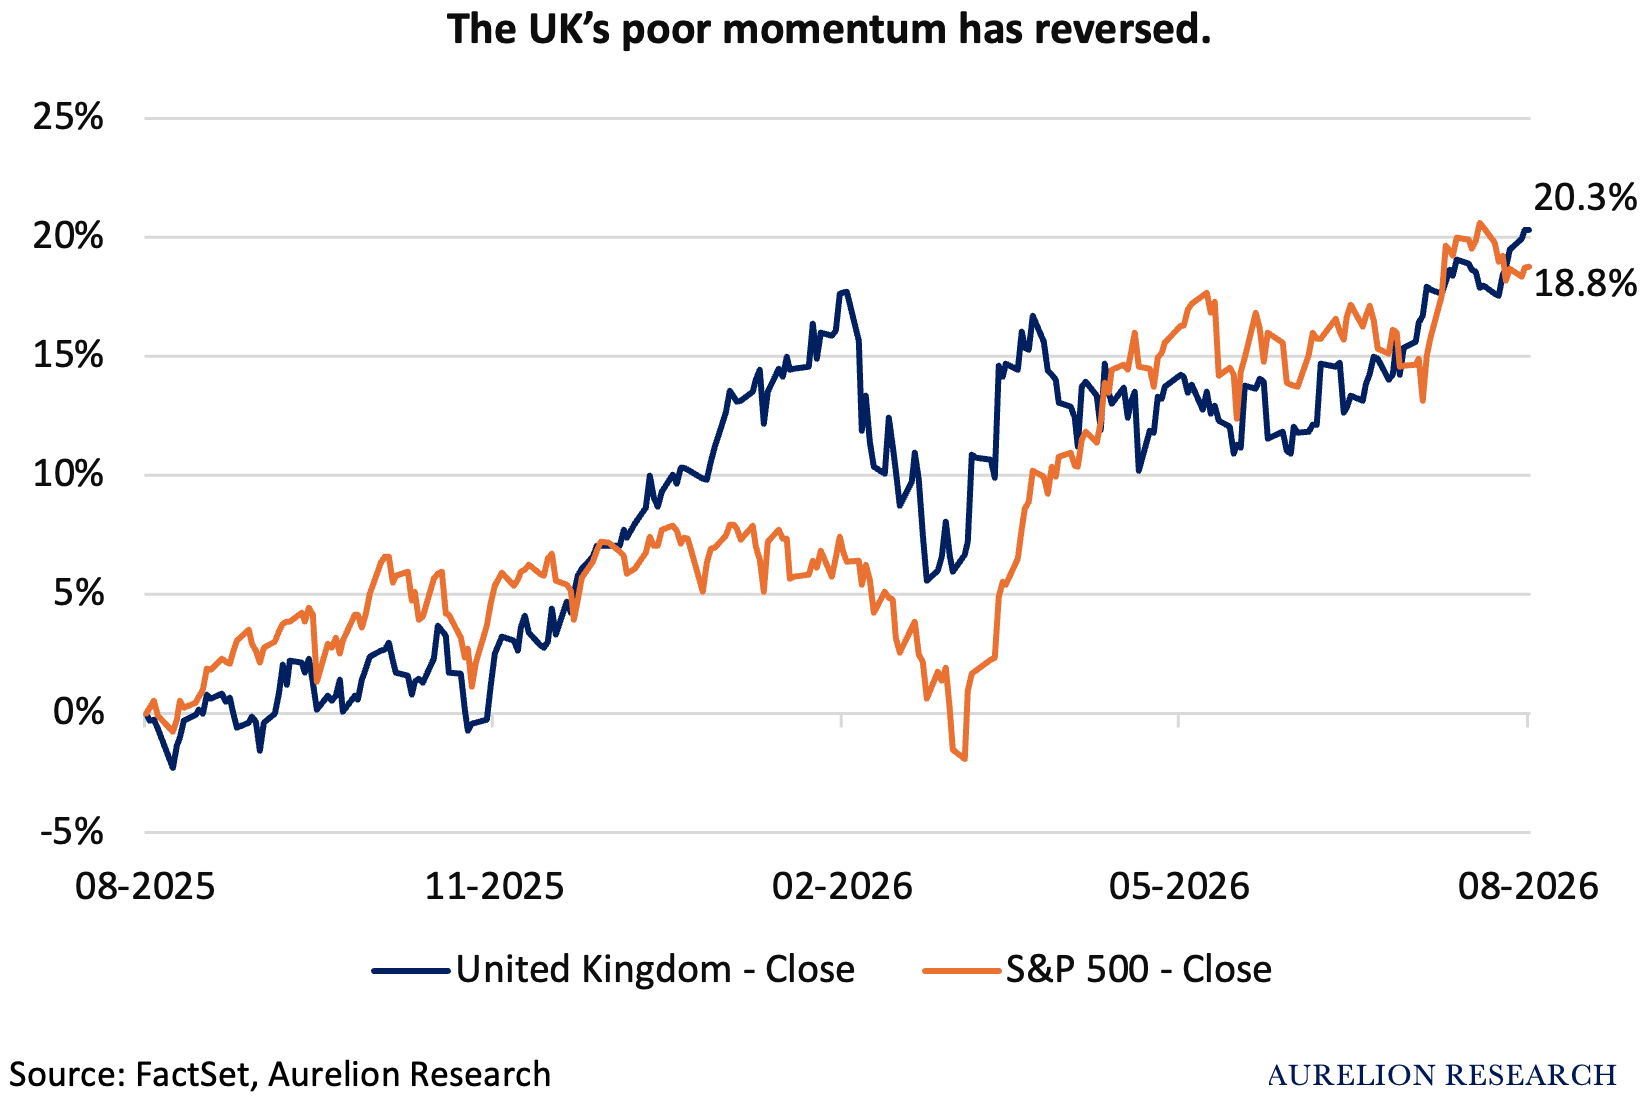
However, FTSE 100 performance has started to turn over the past year. With almost no tech exposure, the UK market’s gains have been driven mainly by financials, defense, and expectations of lower interest rates.
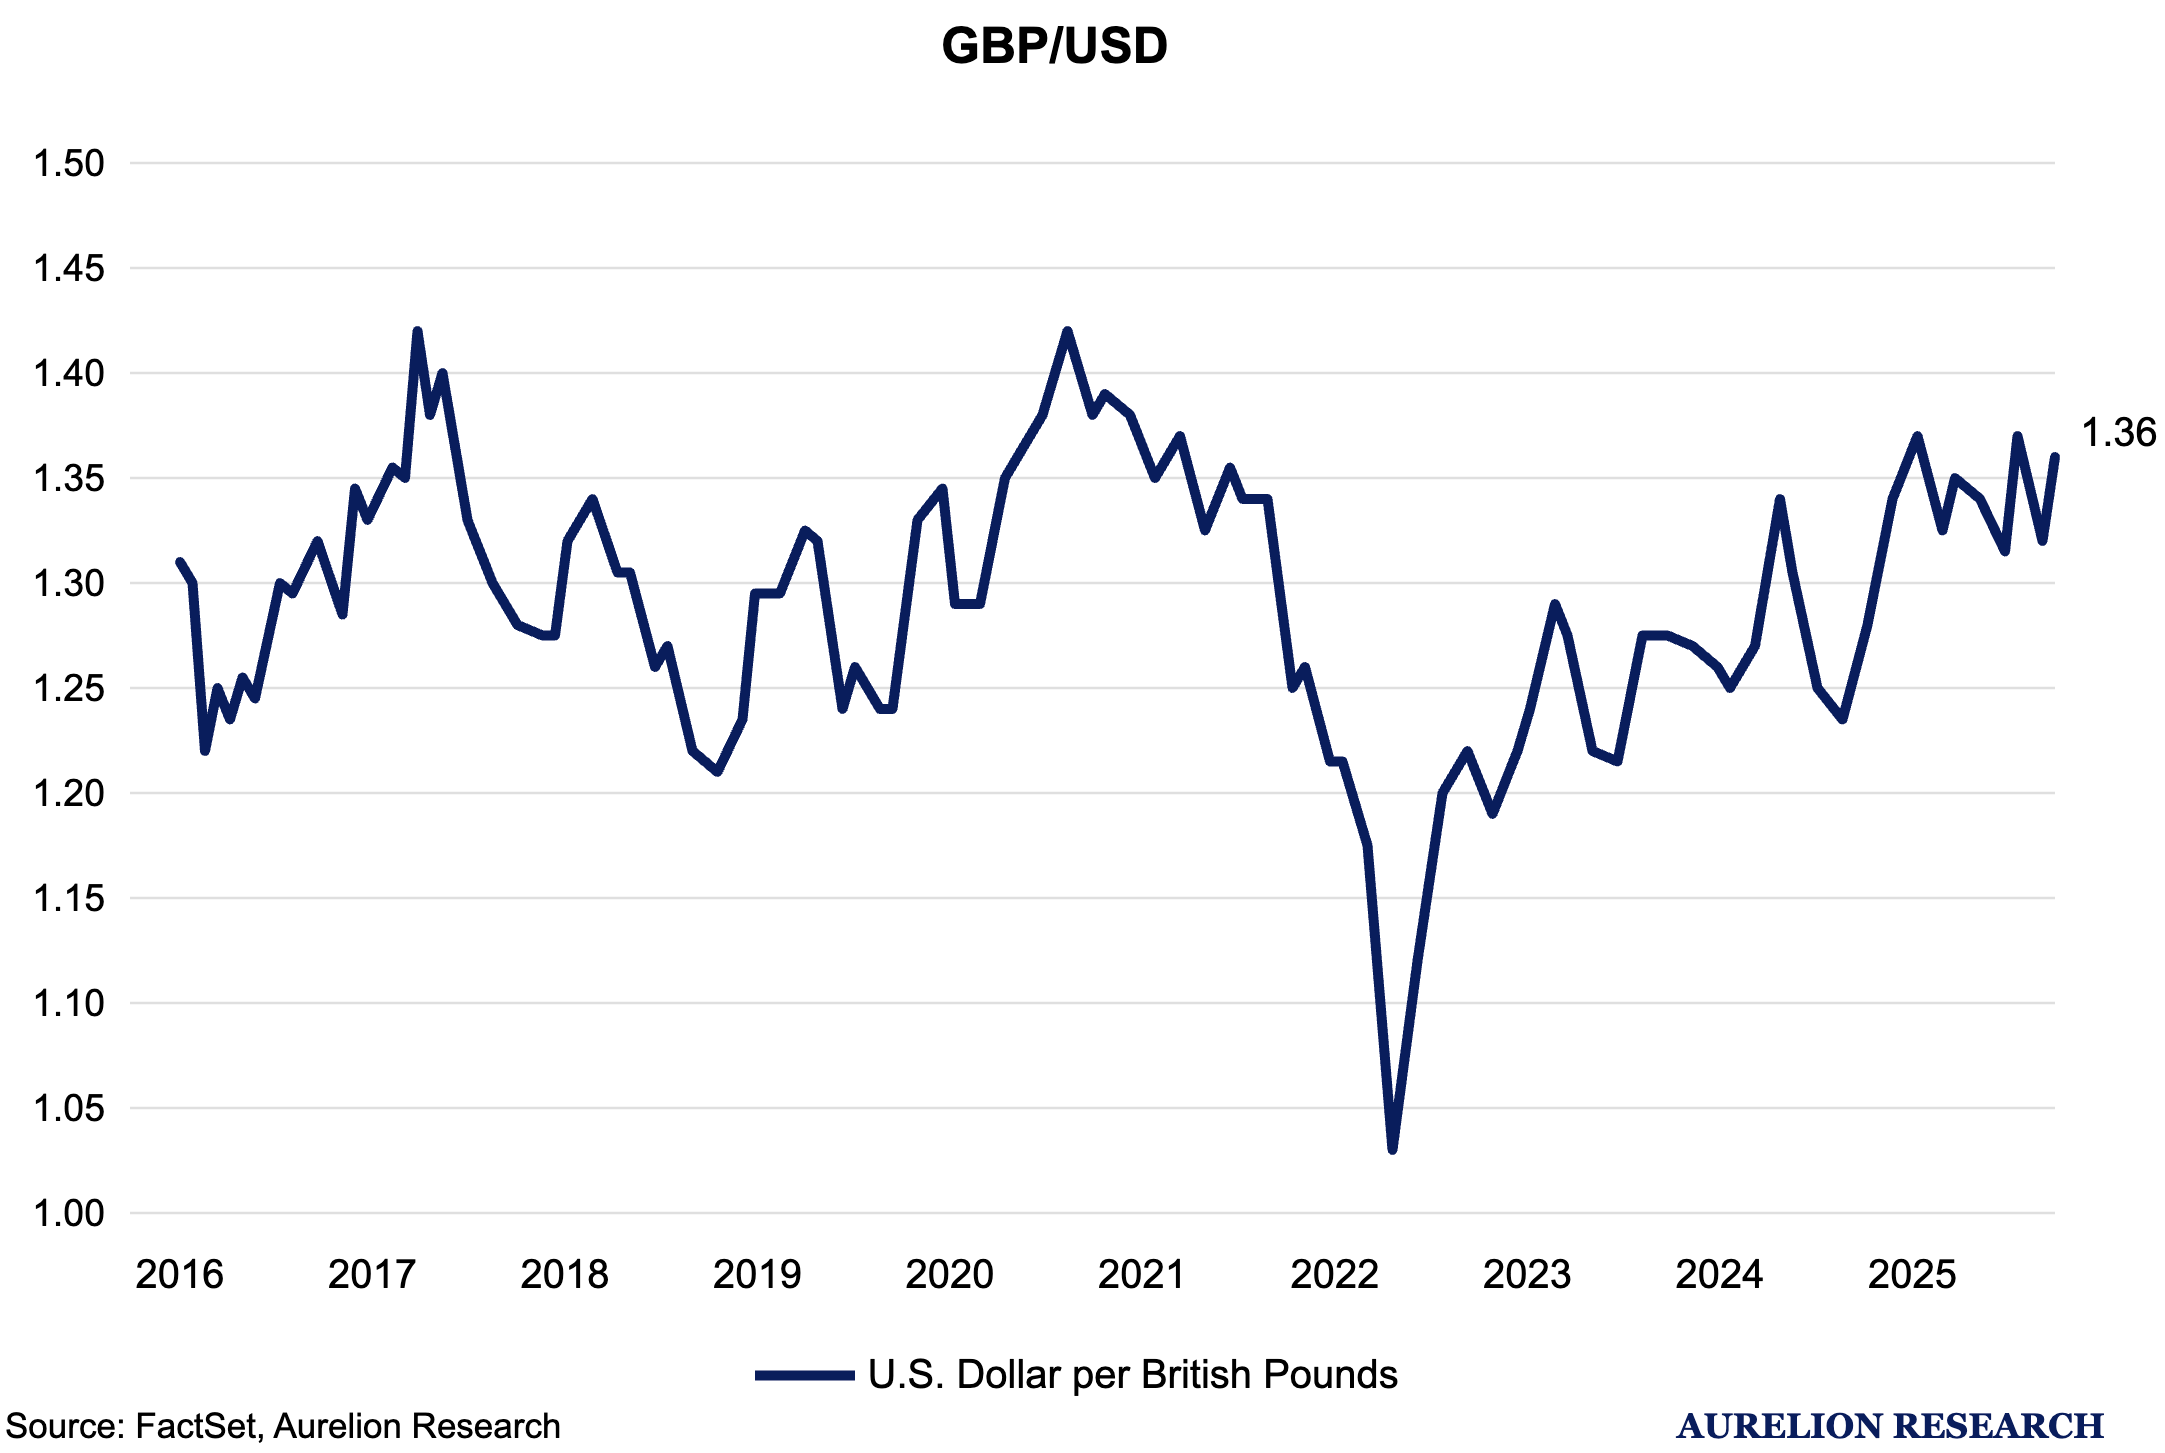
We then turn to the British pound (GBP), which was trading at 1.39 against the US dollar in August 2021 and remains at a similar level today, at 1.36. Notably, GBP/USD fell to a low of 1.0359 in September 2022 amid growing political concerns in the UK.
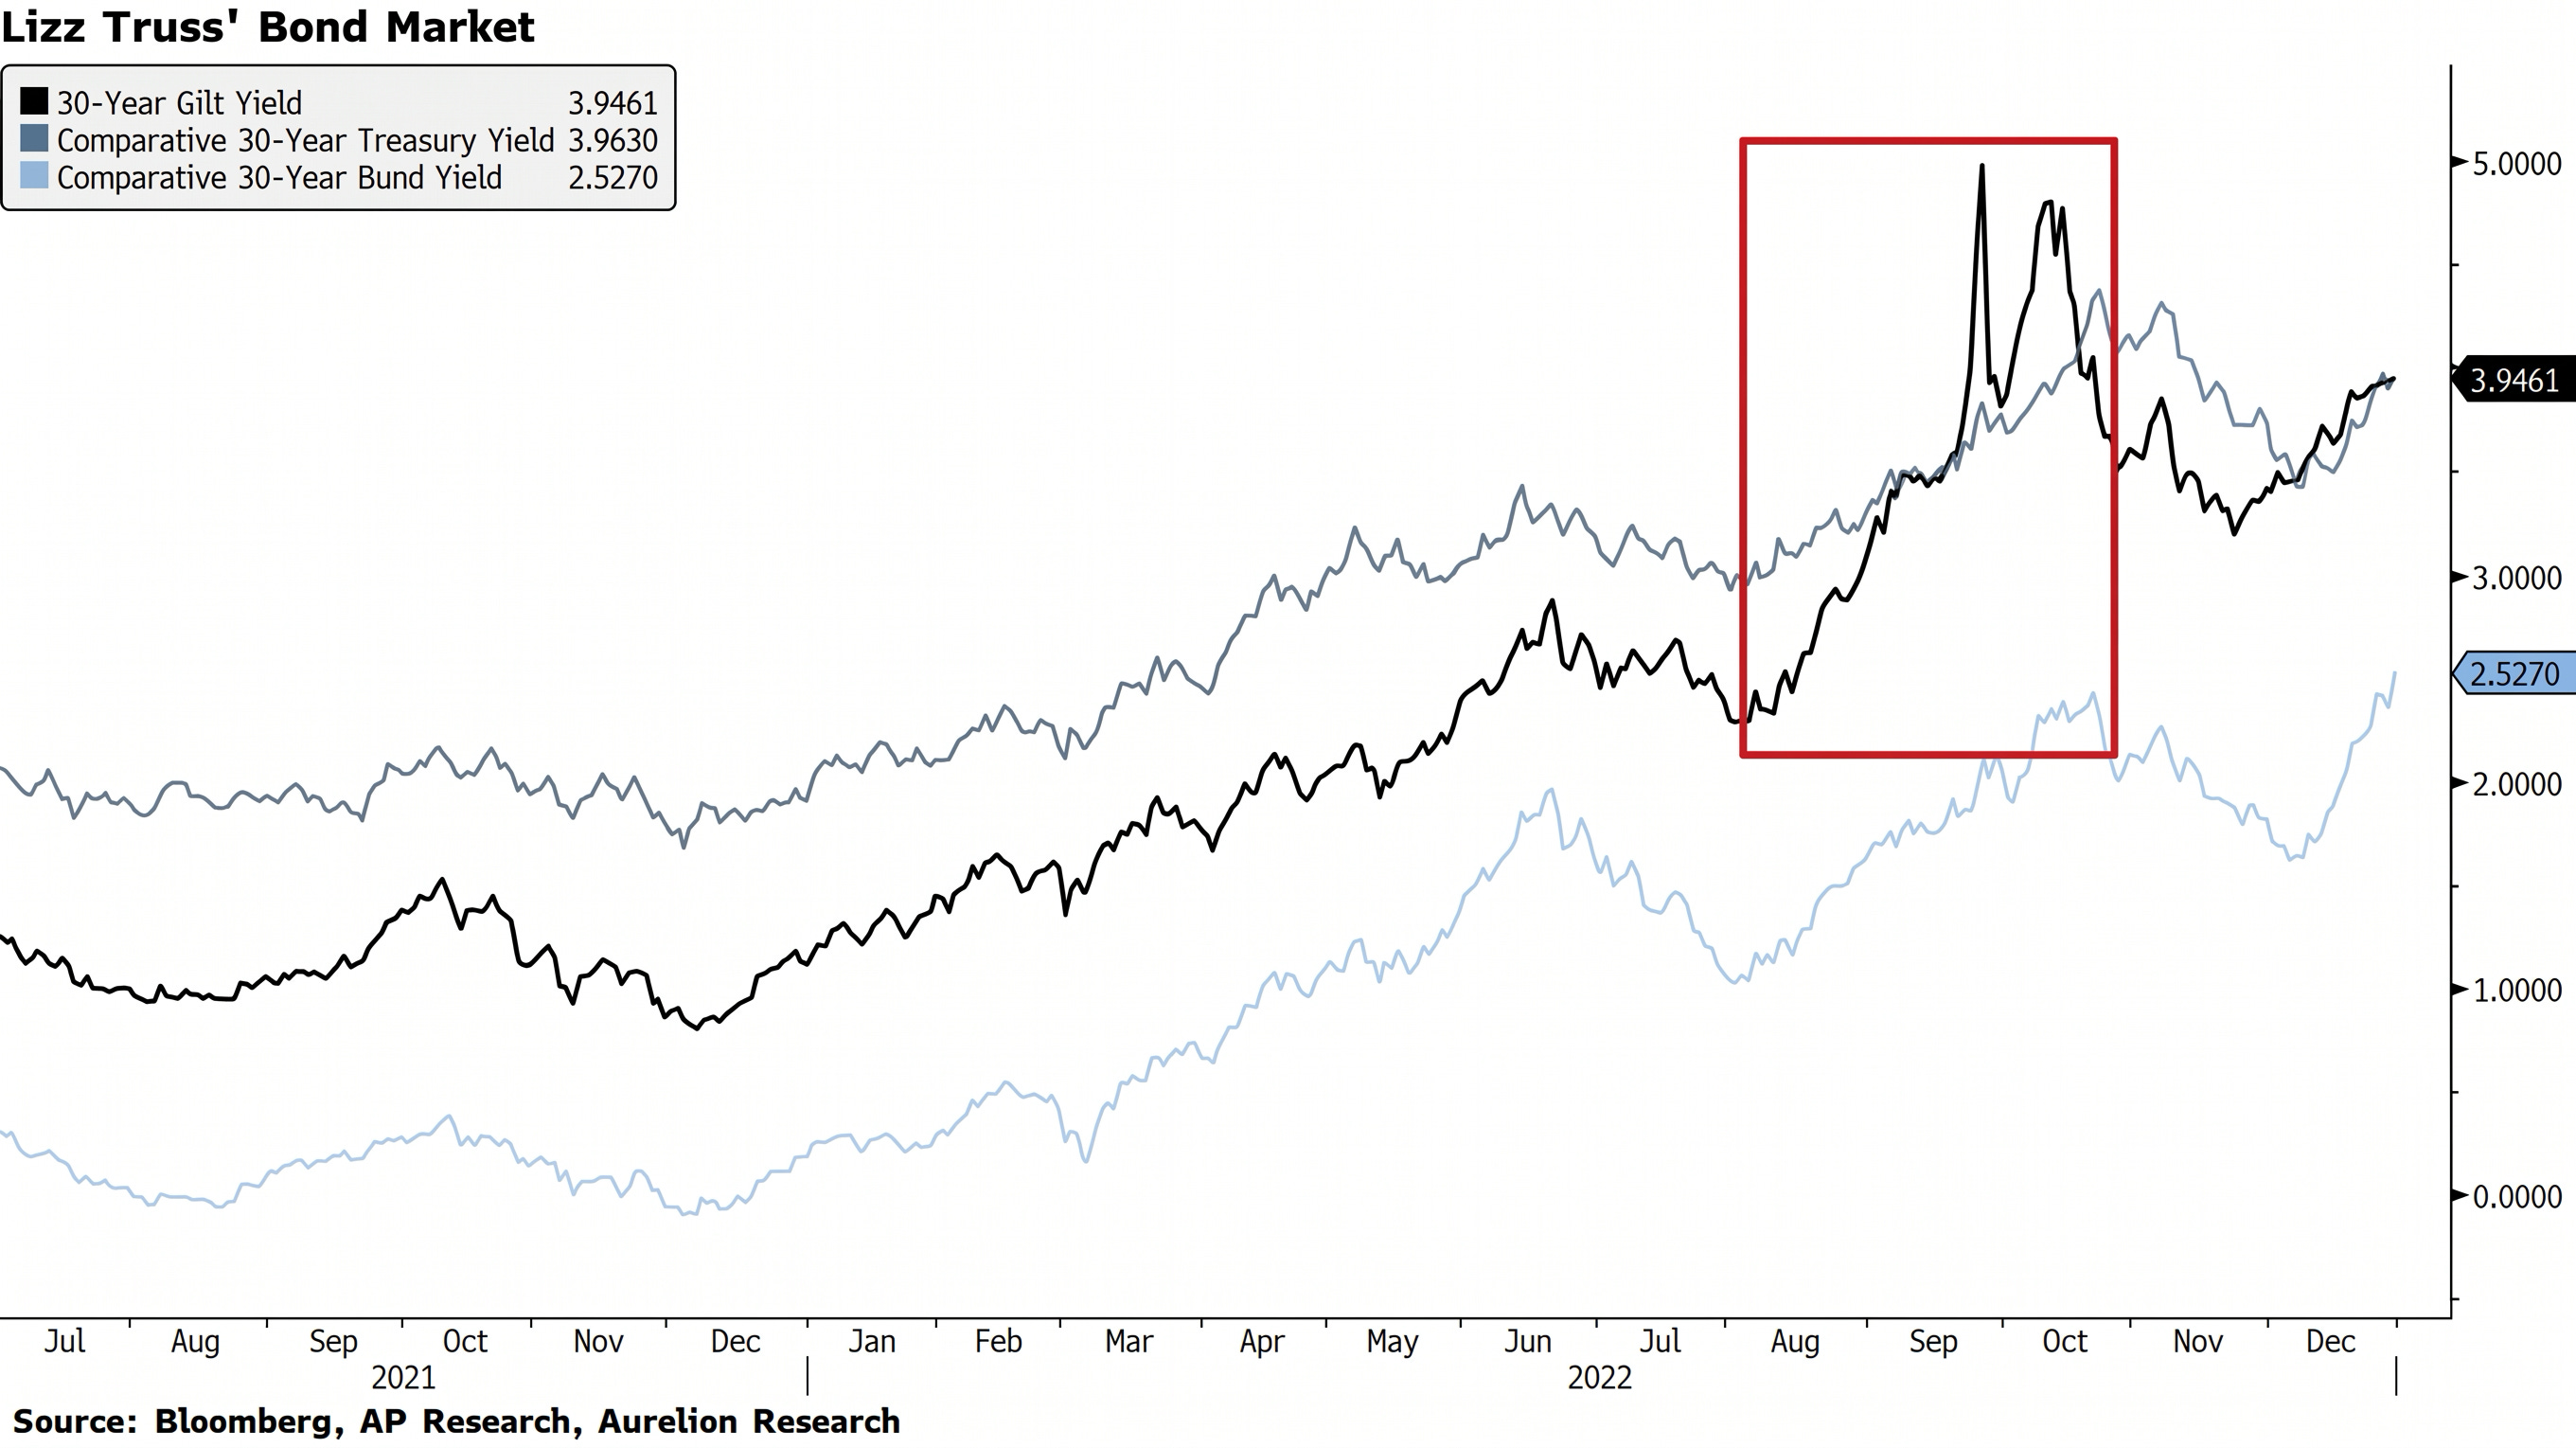
Next, we turn to the bond market. The long end of the Gilt curve has risen significantly in recent years, with both 10-Year and 30-Year UK government bond yields reaching their highest levels in decades. Loose fiscal policy, weak economic growth, and persistent inflation have pushed yields higher as investors demand greater compensation for holding UK government debt.
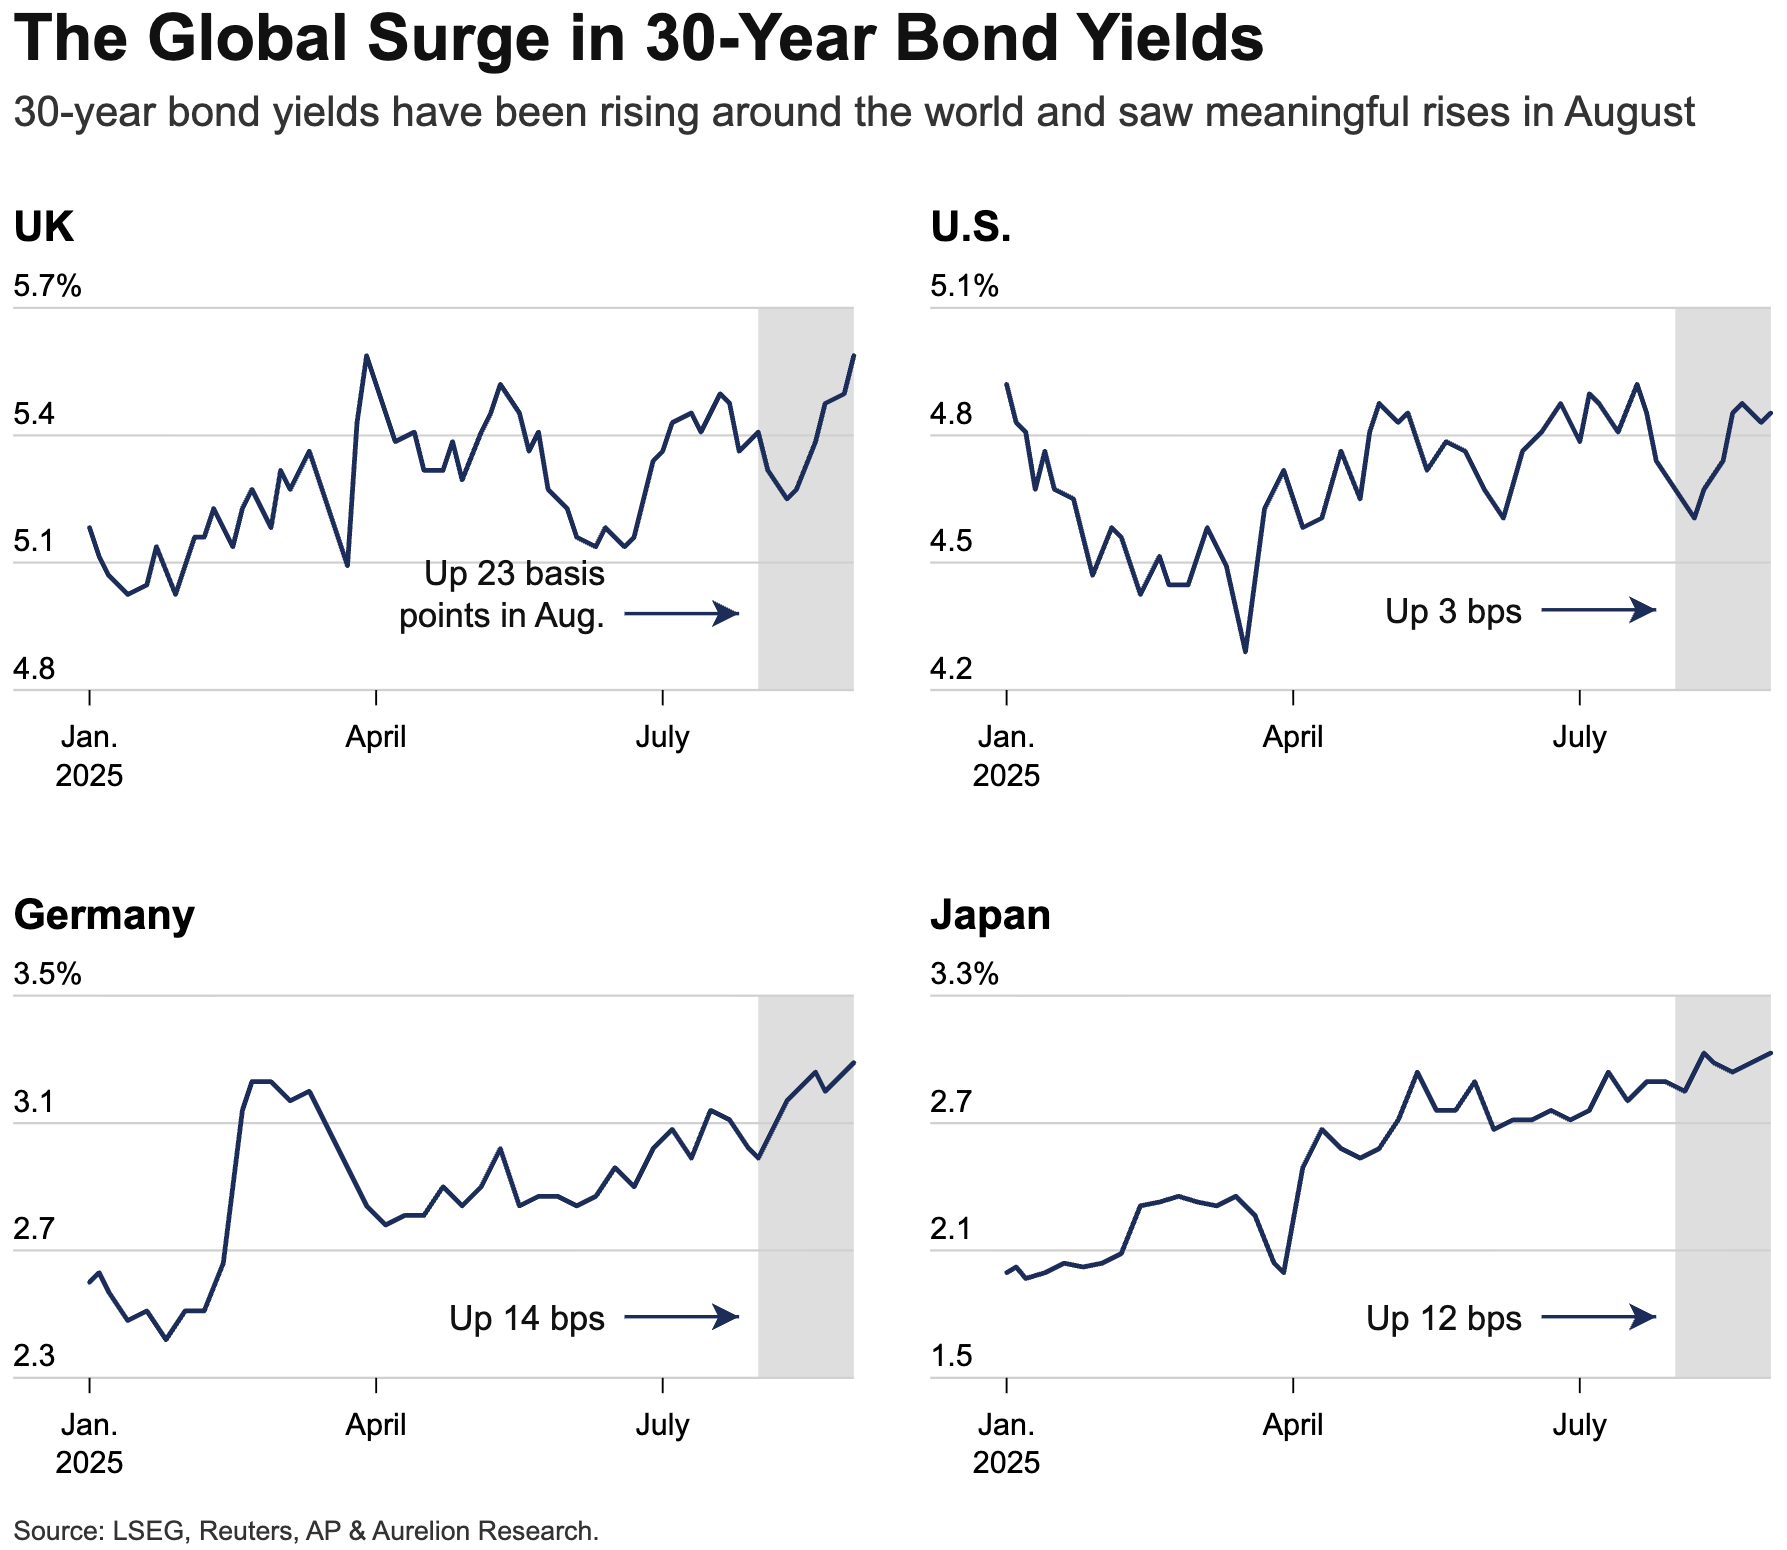
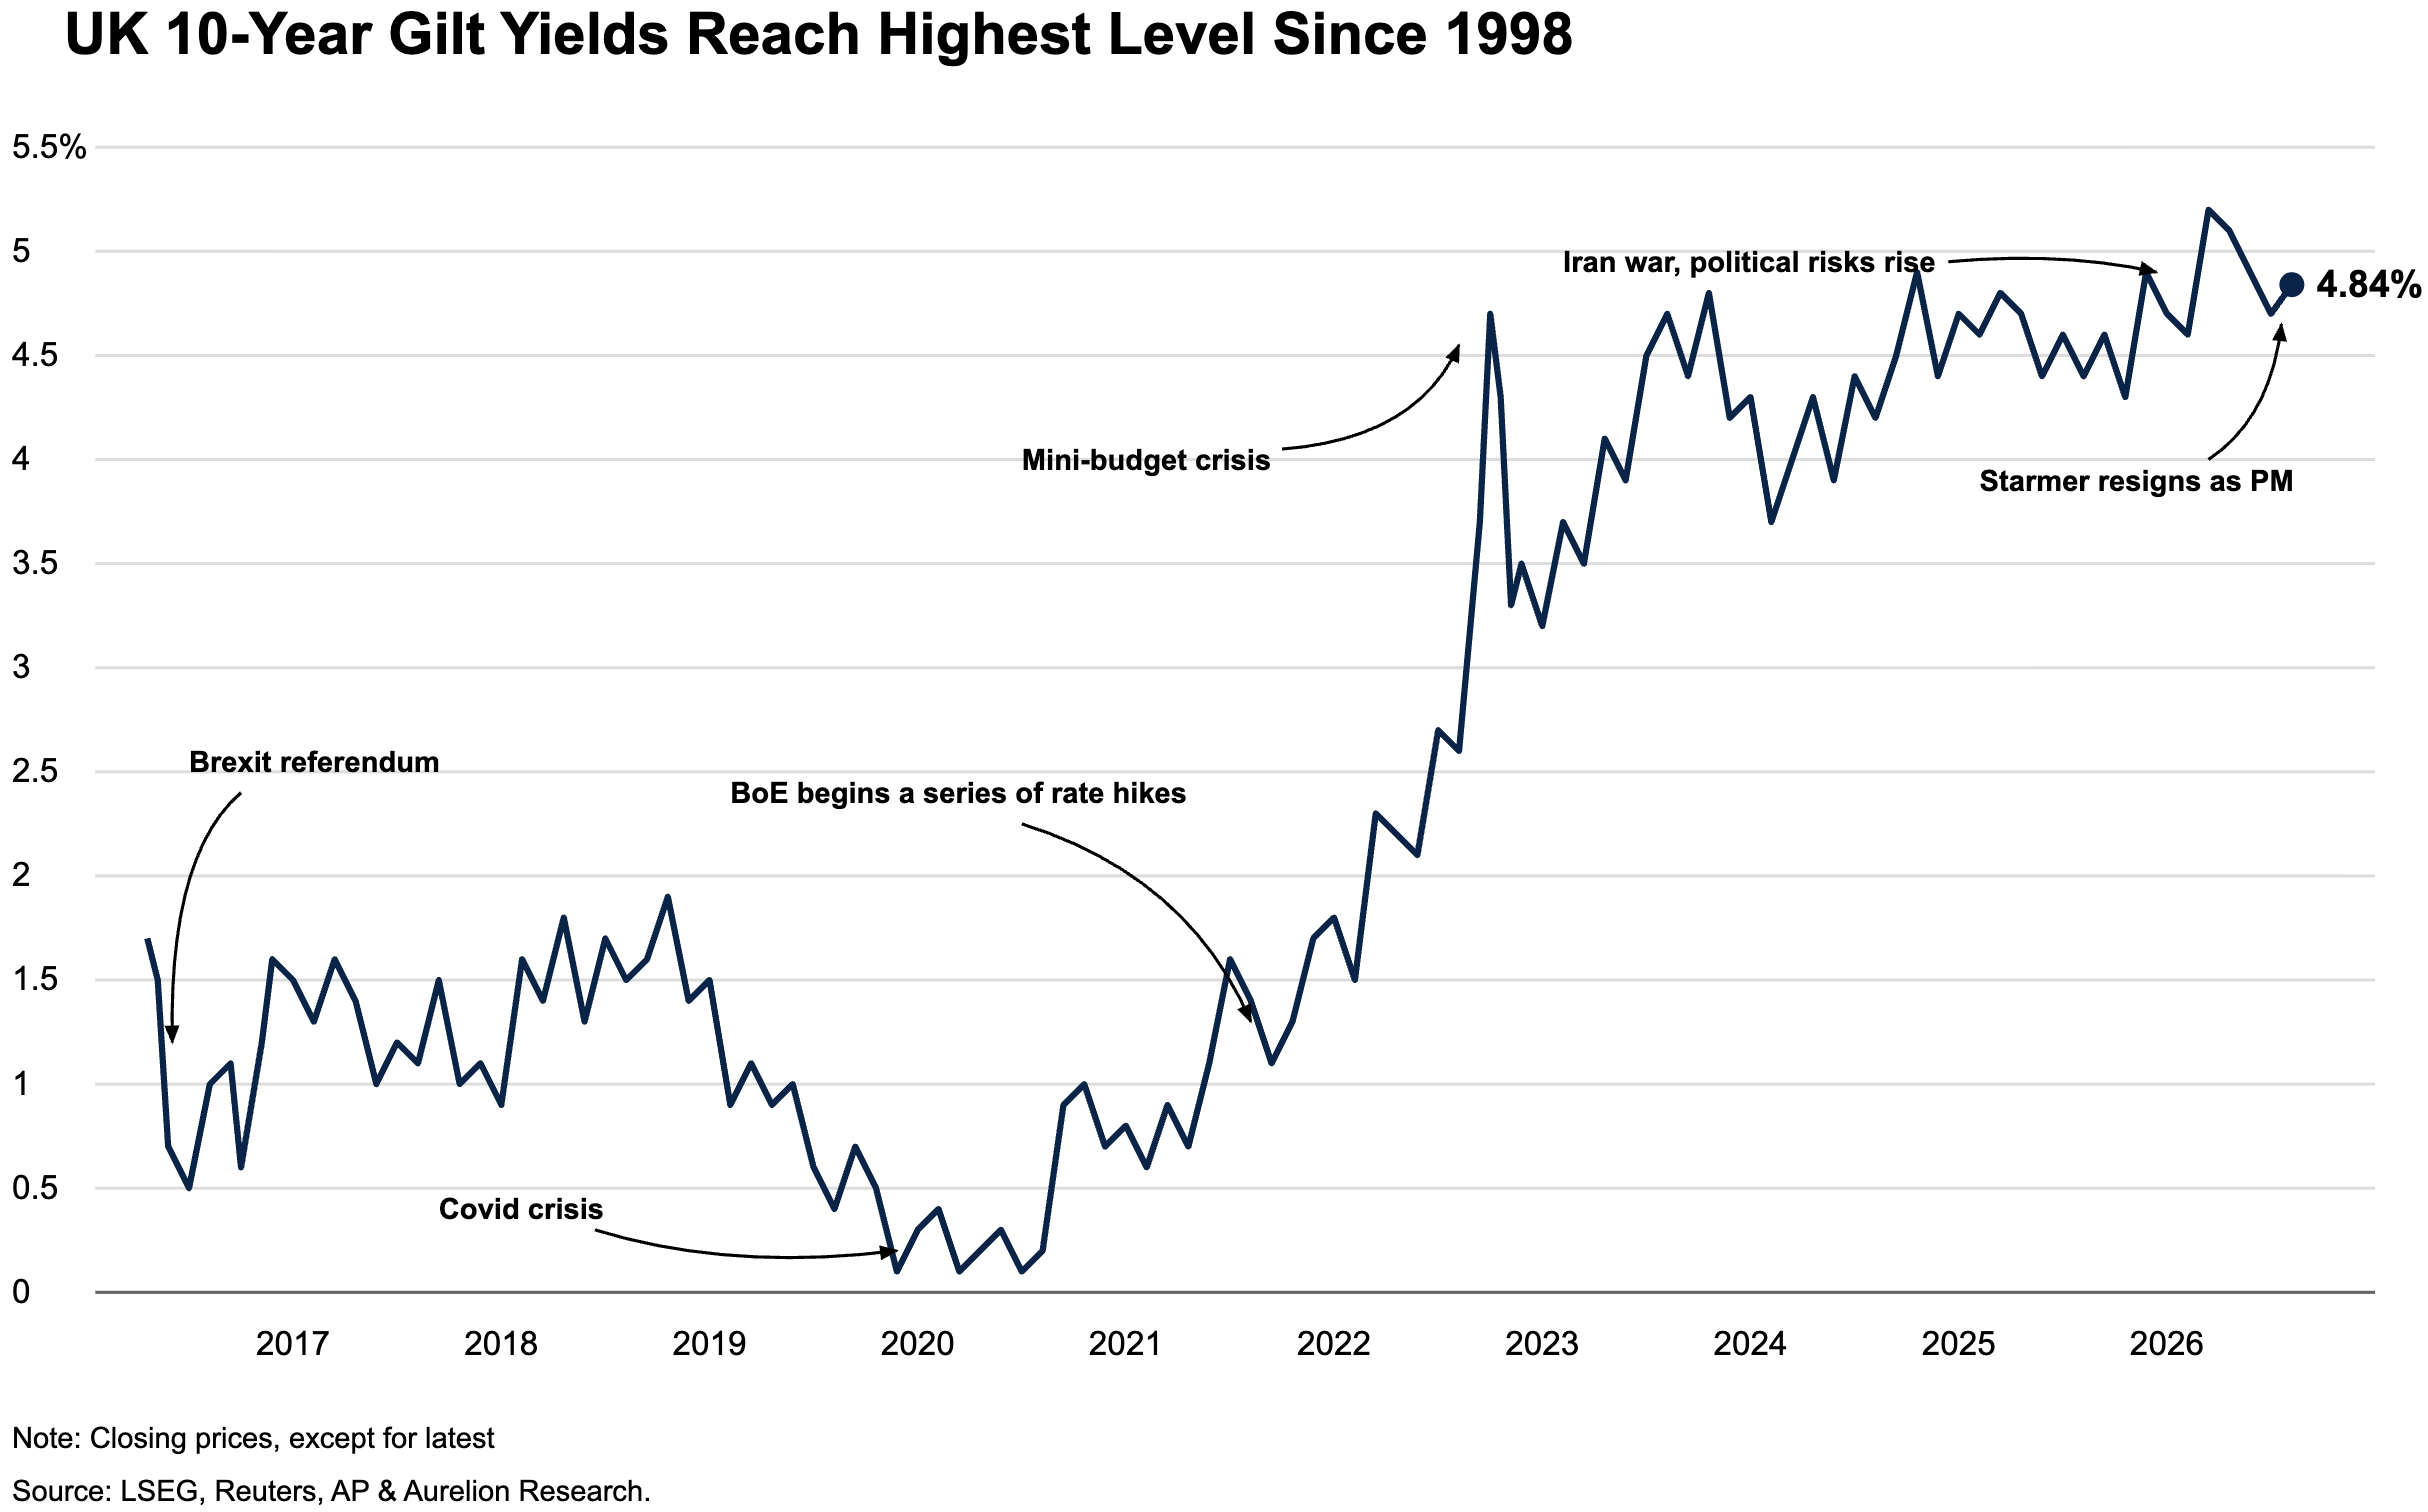
The UK’s move has been partly driven by a global selloff in long-term bonds. 30-year US Treasury yields reached their highest level since 2007, while German 30-year yields reached levels last seen in 2011. However, the UK stands out for both its higher absolute yields and the large increase in the extra return required to hold longer-term UK debt. This reflects concerns over government spending, weaker demand for UK bonds, and persistent inflation, all of which have been more pronounced in the UK than in most other G7 economies.
Taken together, these three asset classes paint a consistent picture. Over the past five years, the market has demanded a higher risk premium to own UK assets.
Equities have been held back by weak earnings expectations, political uncertainty, and continued capital outflows. Sterling has struggled as weak productivity growth, a current account deficit, and inconsistent government policies have weighed on international confidence.
Meanwhile, Gilt yields have risen significantly as the market has demanded more compensation for lending to a government facing higher debt, large borrowing needs, and an economy struggling to generate sustained growth.
In our view, there is some irony here: these same headwinds have also created the foundations for an opportunity. The UK is starting from a much lower base, while some of the factors that held the market back are beginning to improve.
2. Why We Are Bullish on the UK
We split our reasoning into three growth drivers.
The first is what we call legacy investor ignorance.
Despite many of the UK’s largest companies generating the majority of their revenues overseas, they continue to trade at a sizeable valuation discount to peers in the US and other developed markets. This discount may have been justified in the years immediately following Brexit, but six years later, it increasingly looks disconnected from the fundamentals. We see this as our first growth driver because the market is already starting to recognize this valuation gap.
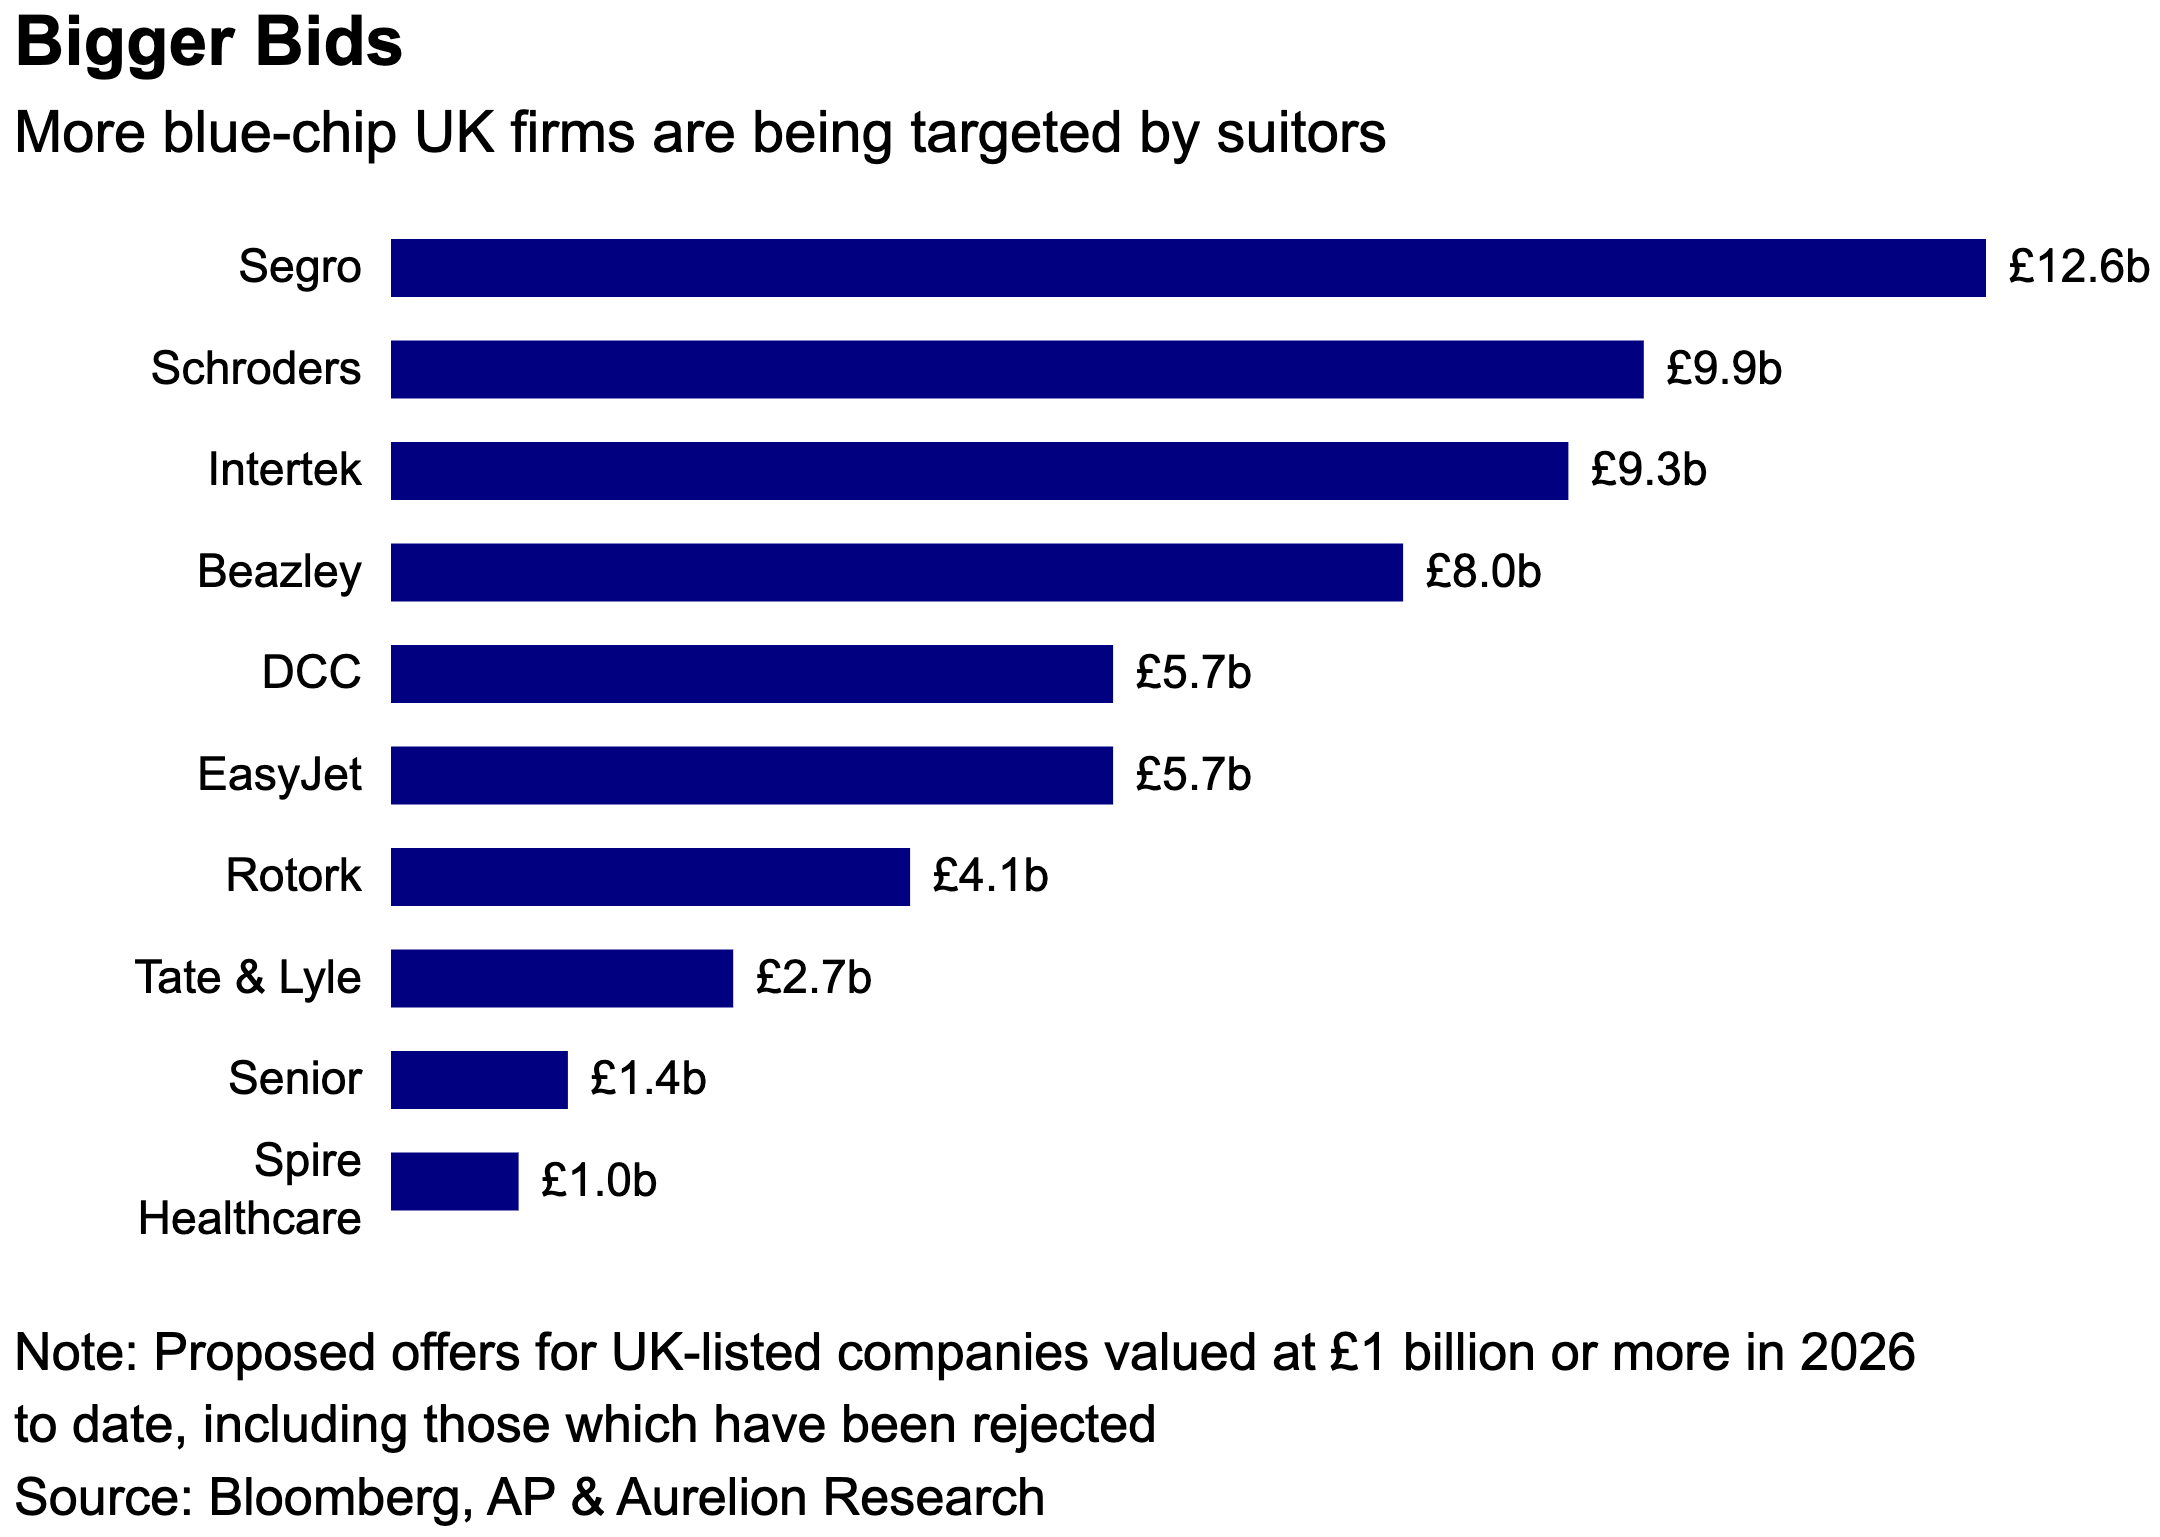
Takeover activity has also picked up significantly, as overseas buyers and private equity firms continue to take advantage of depressed UK valuations. UK public M&A reached £35.3B in the first half of this year, compared with £22B in H1 2025 and £18.5B in H2 2025. Overseas bidders accounted for 94% of total deal value.
Inbound cross-border M&A activity tells a similar story, with foreign buyers showing a growing appetite for UK companies.

Meanwhile, the FT recently reported that takeover activity involving UK-listed companies has surged 188% year-to-date, marking the strongest pace since 2007.
A second pillar of our bullish view is the political capital being spent by new PM Andy Burnham to kick-start the UK economy. He may have been in office for only a few weeks, but the market’s initial reaction has been broadly positive.
More importantly, the government’s early priorities have focused on unlocking long-term investment rather than short-term fiscal giveaways. Alongside an ambitious programme of planning reform and housebuilding, Burnham has repeatedly emphasized the need to “mobilize British savings to back British growth.” Ministers are also exploring reforms to ISAs and pension funds that could encourage more domestic capital to flow into UK-listed companies.

Even a modest shift in domestic capital allocation could have a meaningful impact on UK equities. We explore how even a partial reversal of pension fund outflows from domestic markets could bring billions of pounds of additional demand into the FTSE 100 and FTSE 250.
Finally, at the index level, the UK market is dominated by large companies in healthcare, commodities, and financial services.
These are three areas where we are currently overweight and expect to remain so in the next cycle, with each benefiting from different tailwinds. As a growth driver, we believe the market is underestimating the potential upside in these sectors as we enter a period of higher infrastructure spending, larger defence budgets, strong commodity demand, and fundamentally higher interest rates.
3. Growth Driver 1: Legacy Investor Ignorance
The shrug of the shoulders when some overseas investors are told about UK equities tells the broad story here. Even though ignorance might be too strong a word, investor indifference and persistent under-allocation certainly help explain the valuation gap between the UK and its developed-market peers.
The scale of the discrepancy is being arbitraged away, but still remains striking. As of the end of July, the MSCI UK traded at 12.85x forward earnings, against 20.37x for MSCI USA and around 15.5x for MSCI EAFE, while offering a 3.05% dividend yield, versus just 1.13% in the US.
In other words, investors are currently paying roughly 37% less for a pound of forecast UK earnings than for the equivalent dollar of US earnings, while simultaneously receiving almost three times the dividend yield.
Of course, some discount is justified. The US market contains many of the world’s highest-growth and highest-margin technology businesses, and those companies deserve higher multiples than mature banks, miners or oil majors.
But we believe the valuation gap is still too large.
We don’t need the valuation gap to disappear entirely for the return implications to become meaningful. If UK forward valuations moved from 12.85x to 14x, for example, that alone would represent roughly 9% multiple expansion.
UK vs. US Equity Valuation Gap (2023–2026)
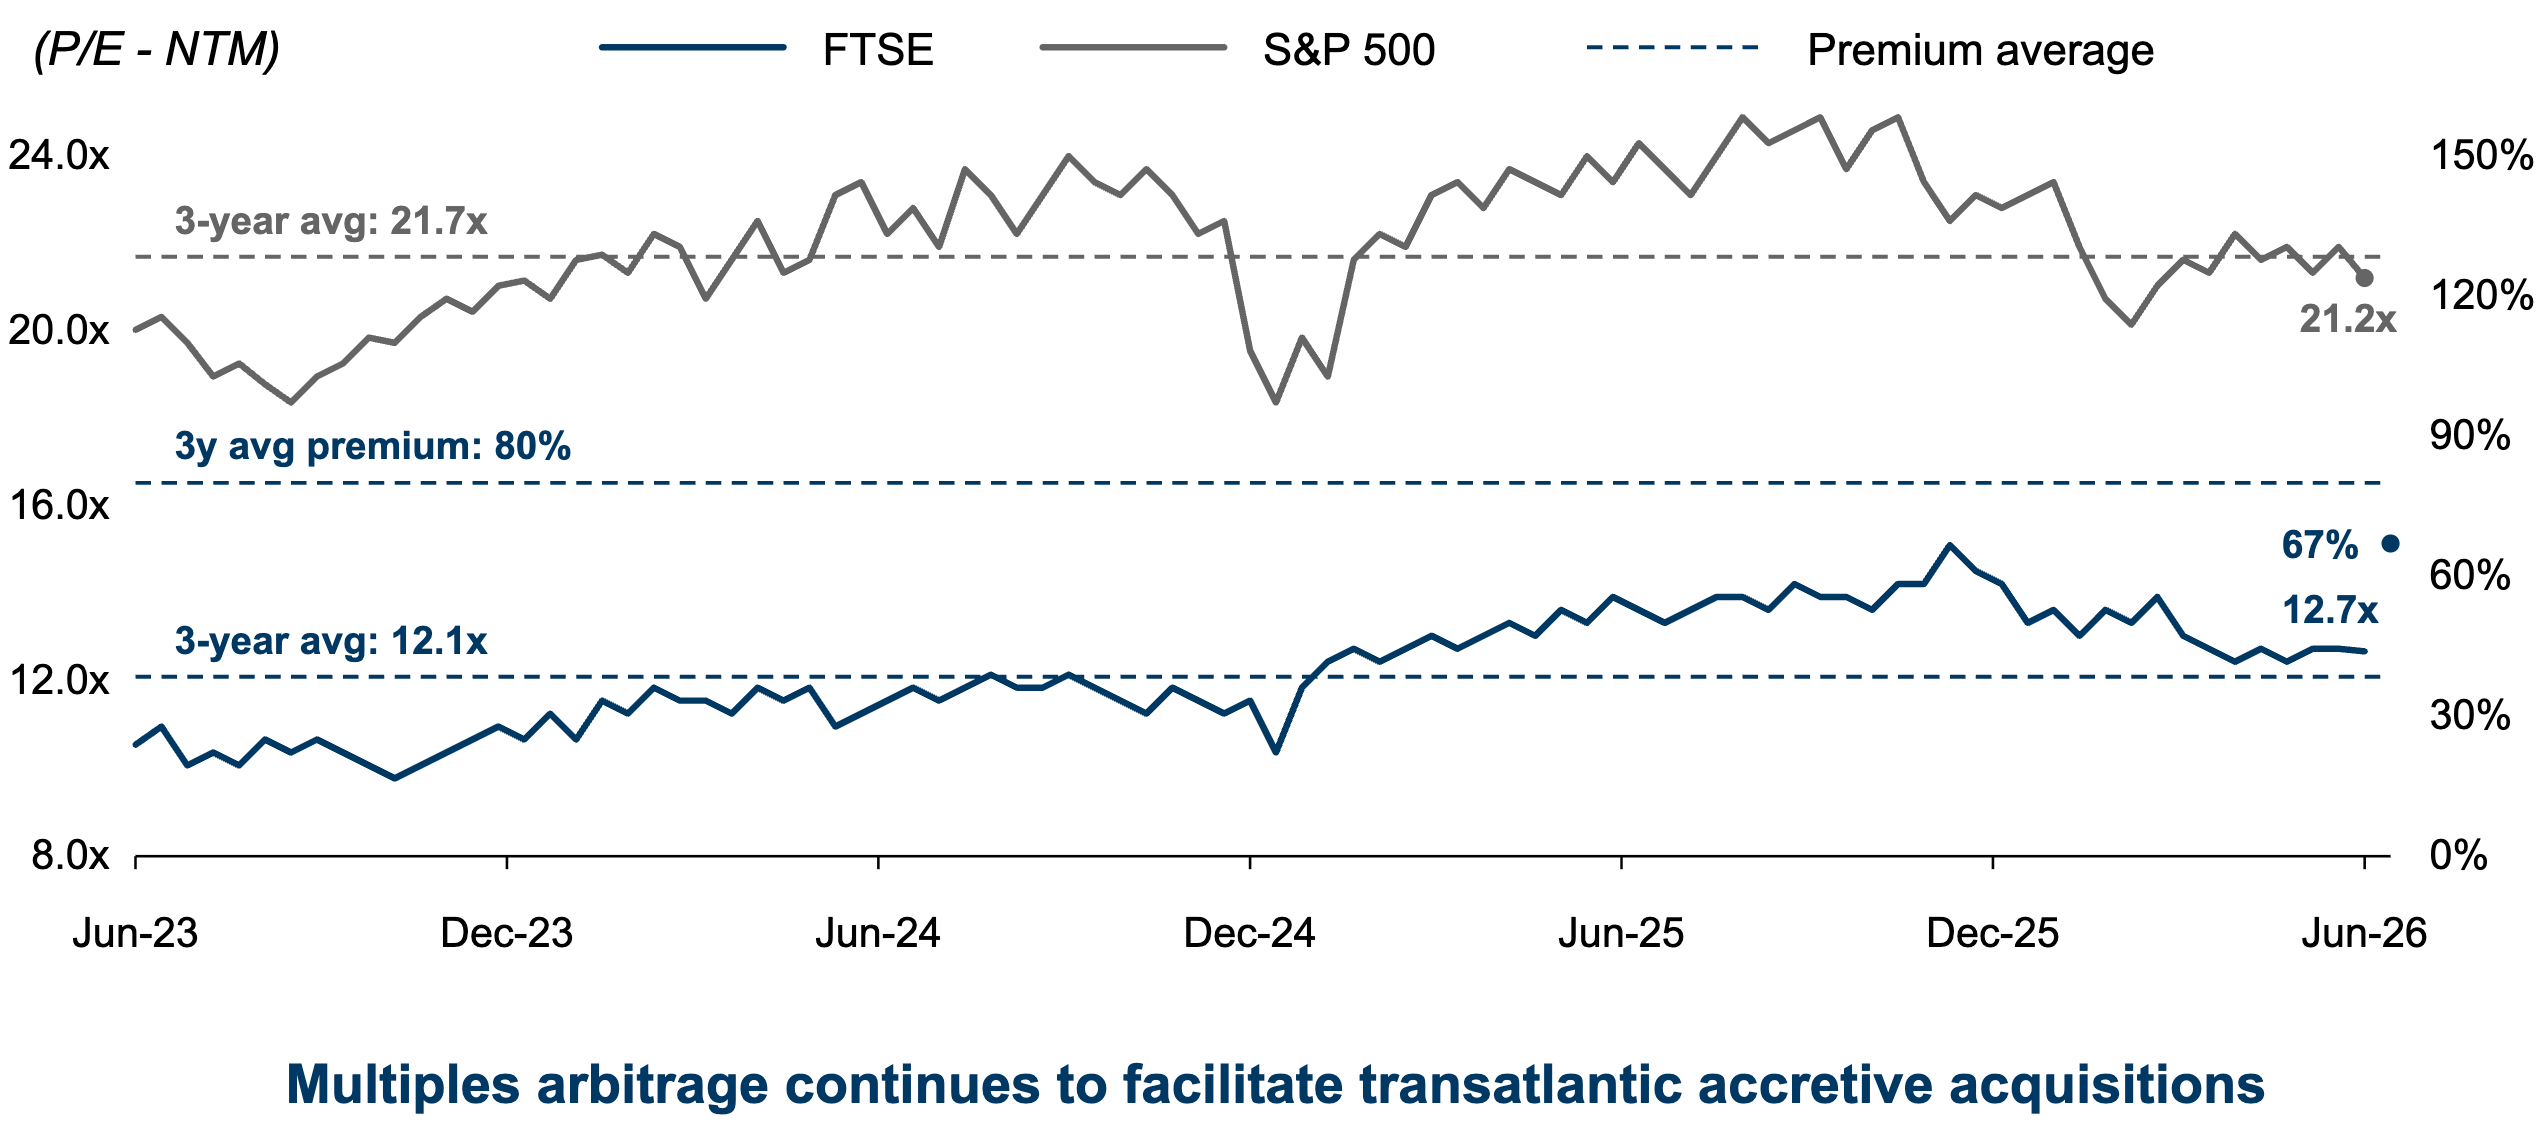
Signs of this process are already emerging. The FTSE 100 has lagged the S&P 500 by only around 250bps over the past year, an impressive result when considering the radically different sector compositions of the two indices (more on that later).
Arguably, the most compelling evidence that the UK discount is becoming excessive comes from ongoing corporate arbitrage. Financial and strategic buyers appear increasingly willing to exploit a valuation discrepancy that public-market investors have been slower to recognize.
By July 1, 2026, announced M&A involving UK targets had exceeded $231bn, 210% above the same point in 2025. Even more strikingly, foreign bidders represented around $197bn and a record 86% of UK-targeted deal value.
It’s not hard to sniff out that when overseas corporations and private-equity firms repeatedly conclude that UK-listed businesses are worth substantially more than their prevailing market capitalization, there’s money to be made.
Companies themselves are reaching much the same conclusion.
UK companies had announced £34.6bn of share buybacks by April 24, 2026. Management teams are opportunistically retiring capital for shares.
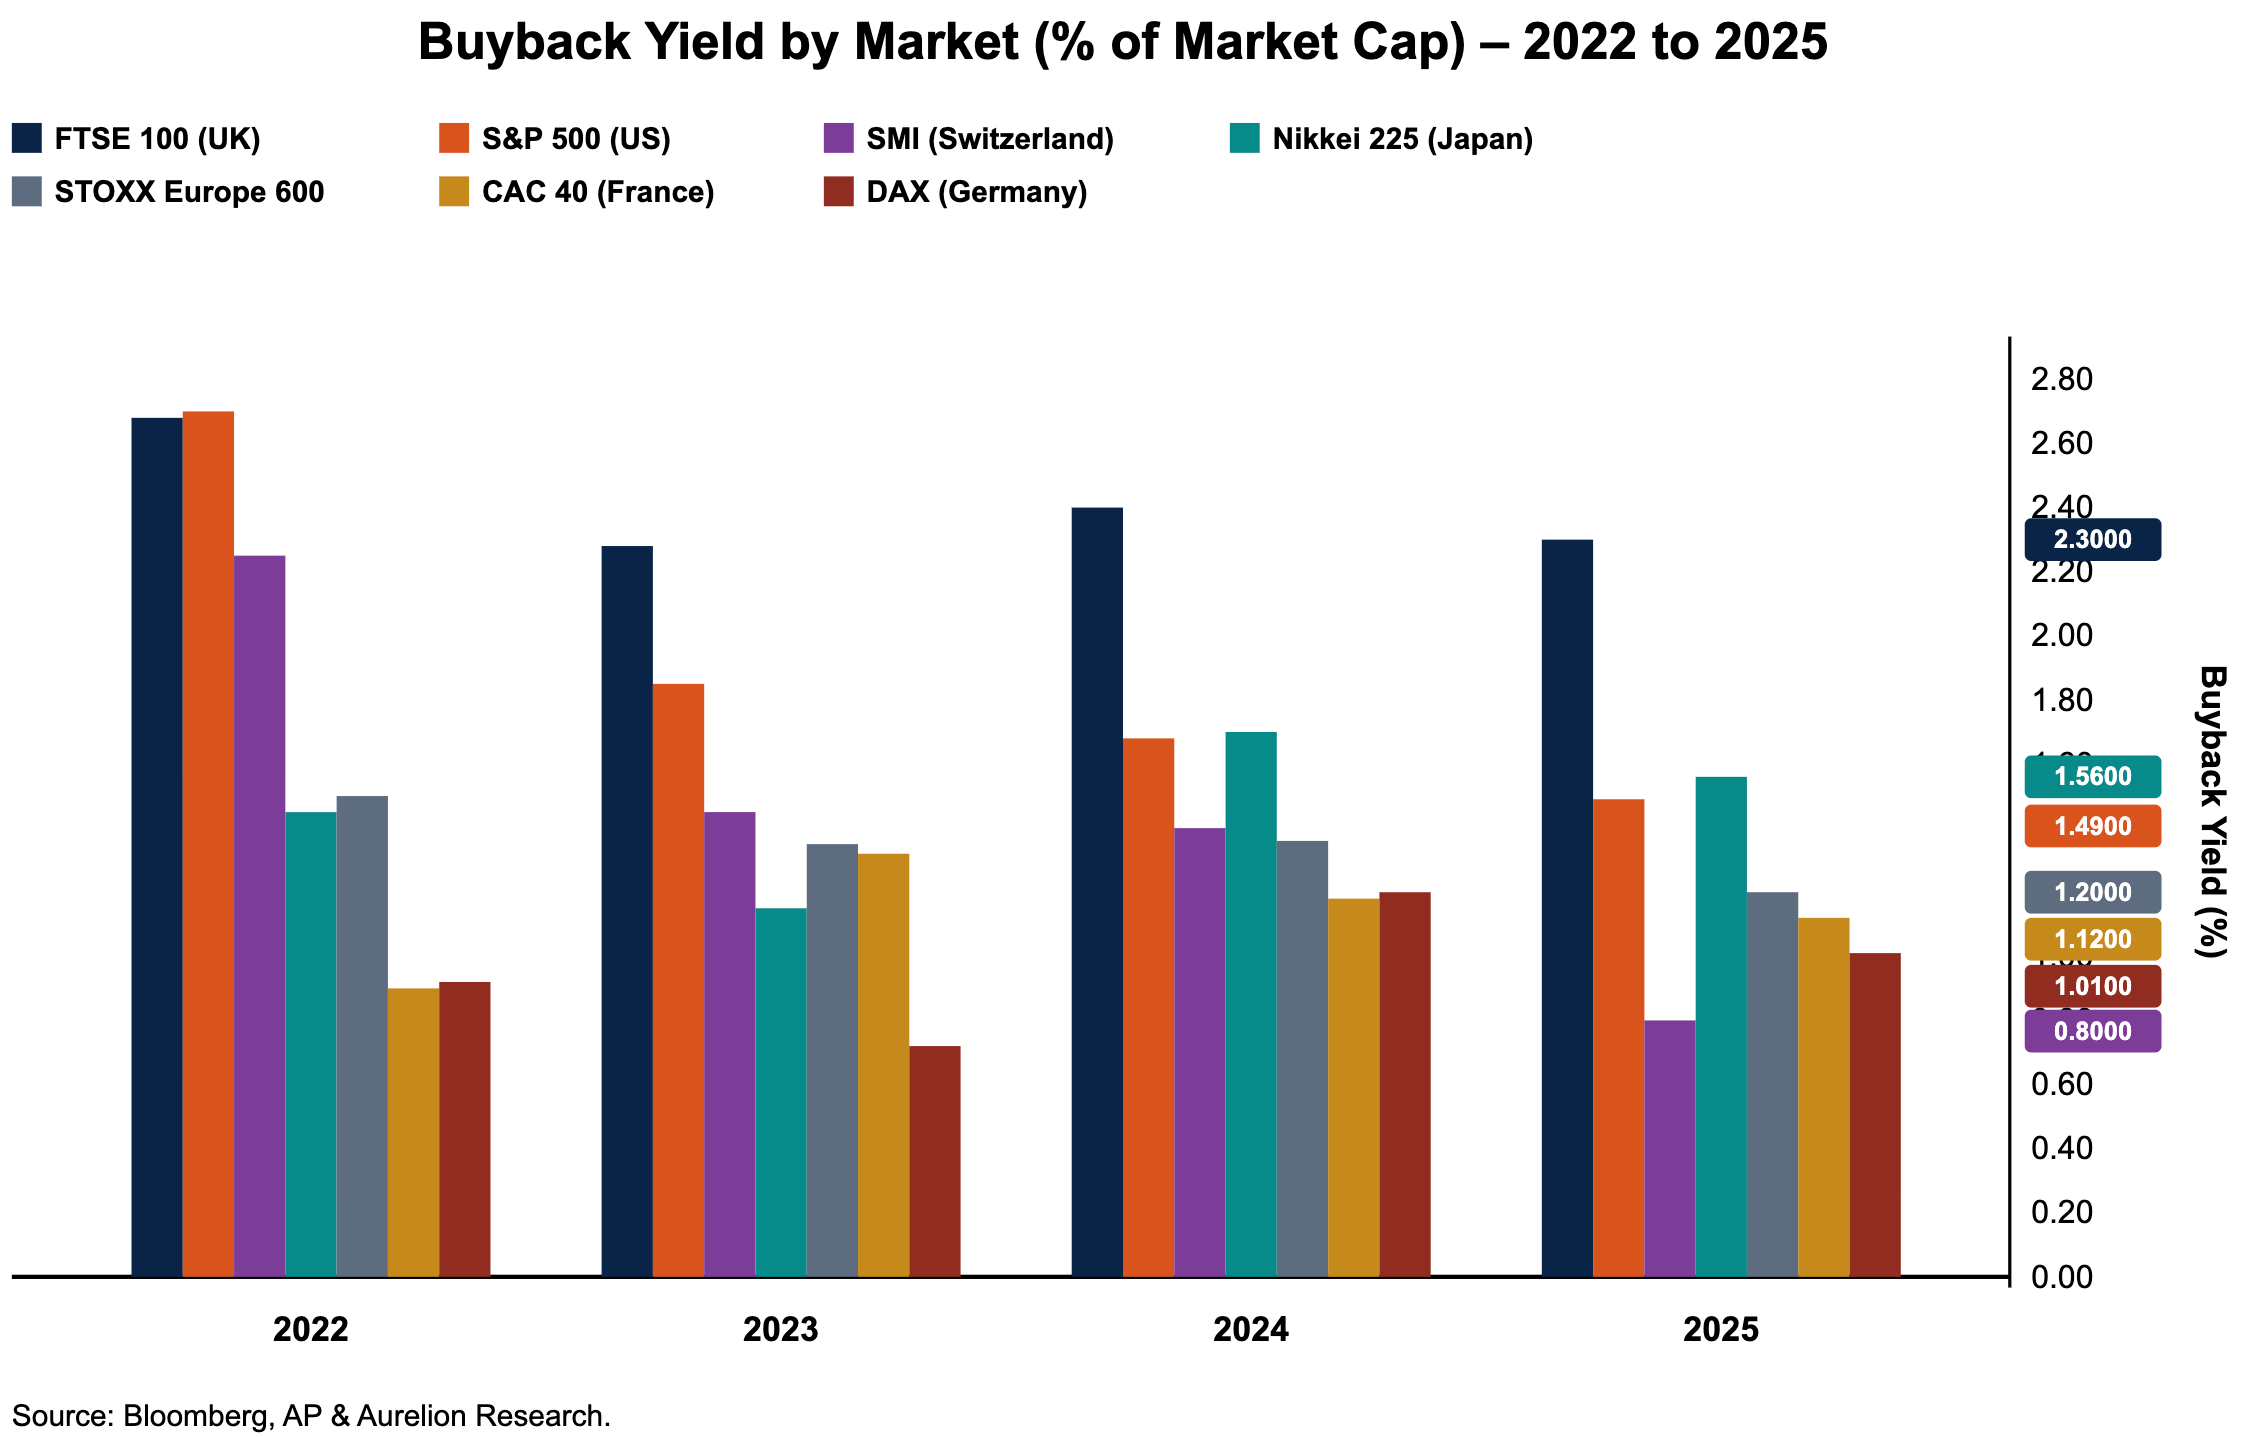
This creates an interesting dynamic. Foreign buyers are removing undervalued UK companies from the market, while listed companies are simultaneously shrinking their own share counts through buybacks. Both reduce the available supply of UK equity. Then if we see a continued demand increase from other marginal buyers for UK stocks, it creates a rising tide.
Just as there is some ignorance around ignoring the UK, we also don’t want to be seen as ignorant in simply saying “UK stocks are cheap”.
Cheap markets can definitely remain cheap indefinitely.
The more compelling argument is that identifiable shifts are now starting to close this valuation gap, creating opportunities for investors to generate meaningful alpha through stock selection. Rather than simply buying the cheapest UK stocks, we favour companies where the valuation discount looks hardest to justify.
For example, international businesses still trading on UK multiples, companies with strong free cash flow and significant buyback capacity, and businesses whose strategic value appears materially higher than their public-market valuation, making them potential M&A targets.
Mid-caps are particularly interesting in this respect, as lower analyst coverage and weaker domestic flows can create more pronounced valuation gaps.
Now, let’s take a look at two ideas we find interesting.
#1 International Consolidated Airlines Group (IAG LN)
International Airlines is the airline group behind British Airways, Iberia, and several other airlines, giving it exposure to both short-haul European travel and long-haul routes, particularly across the North Atlantic.
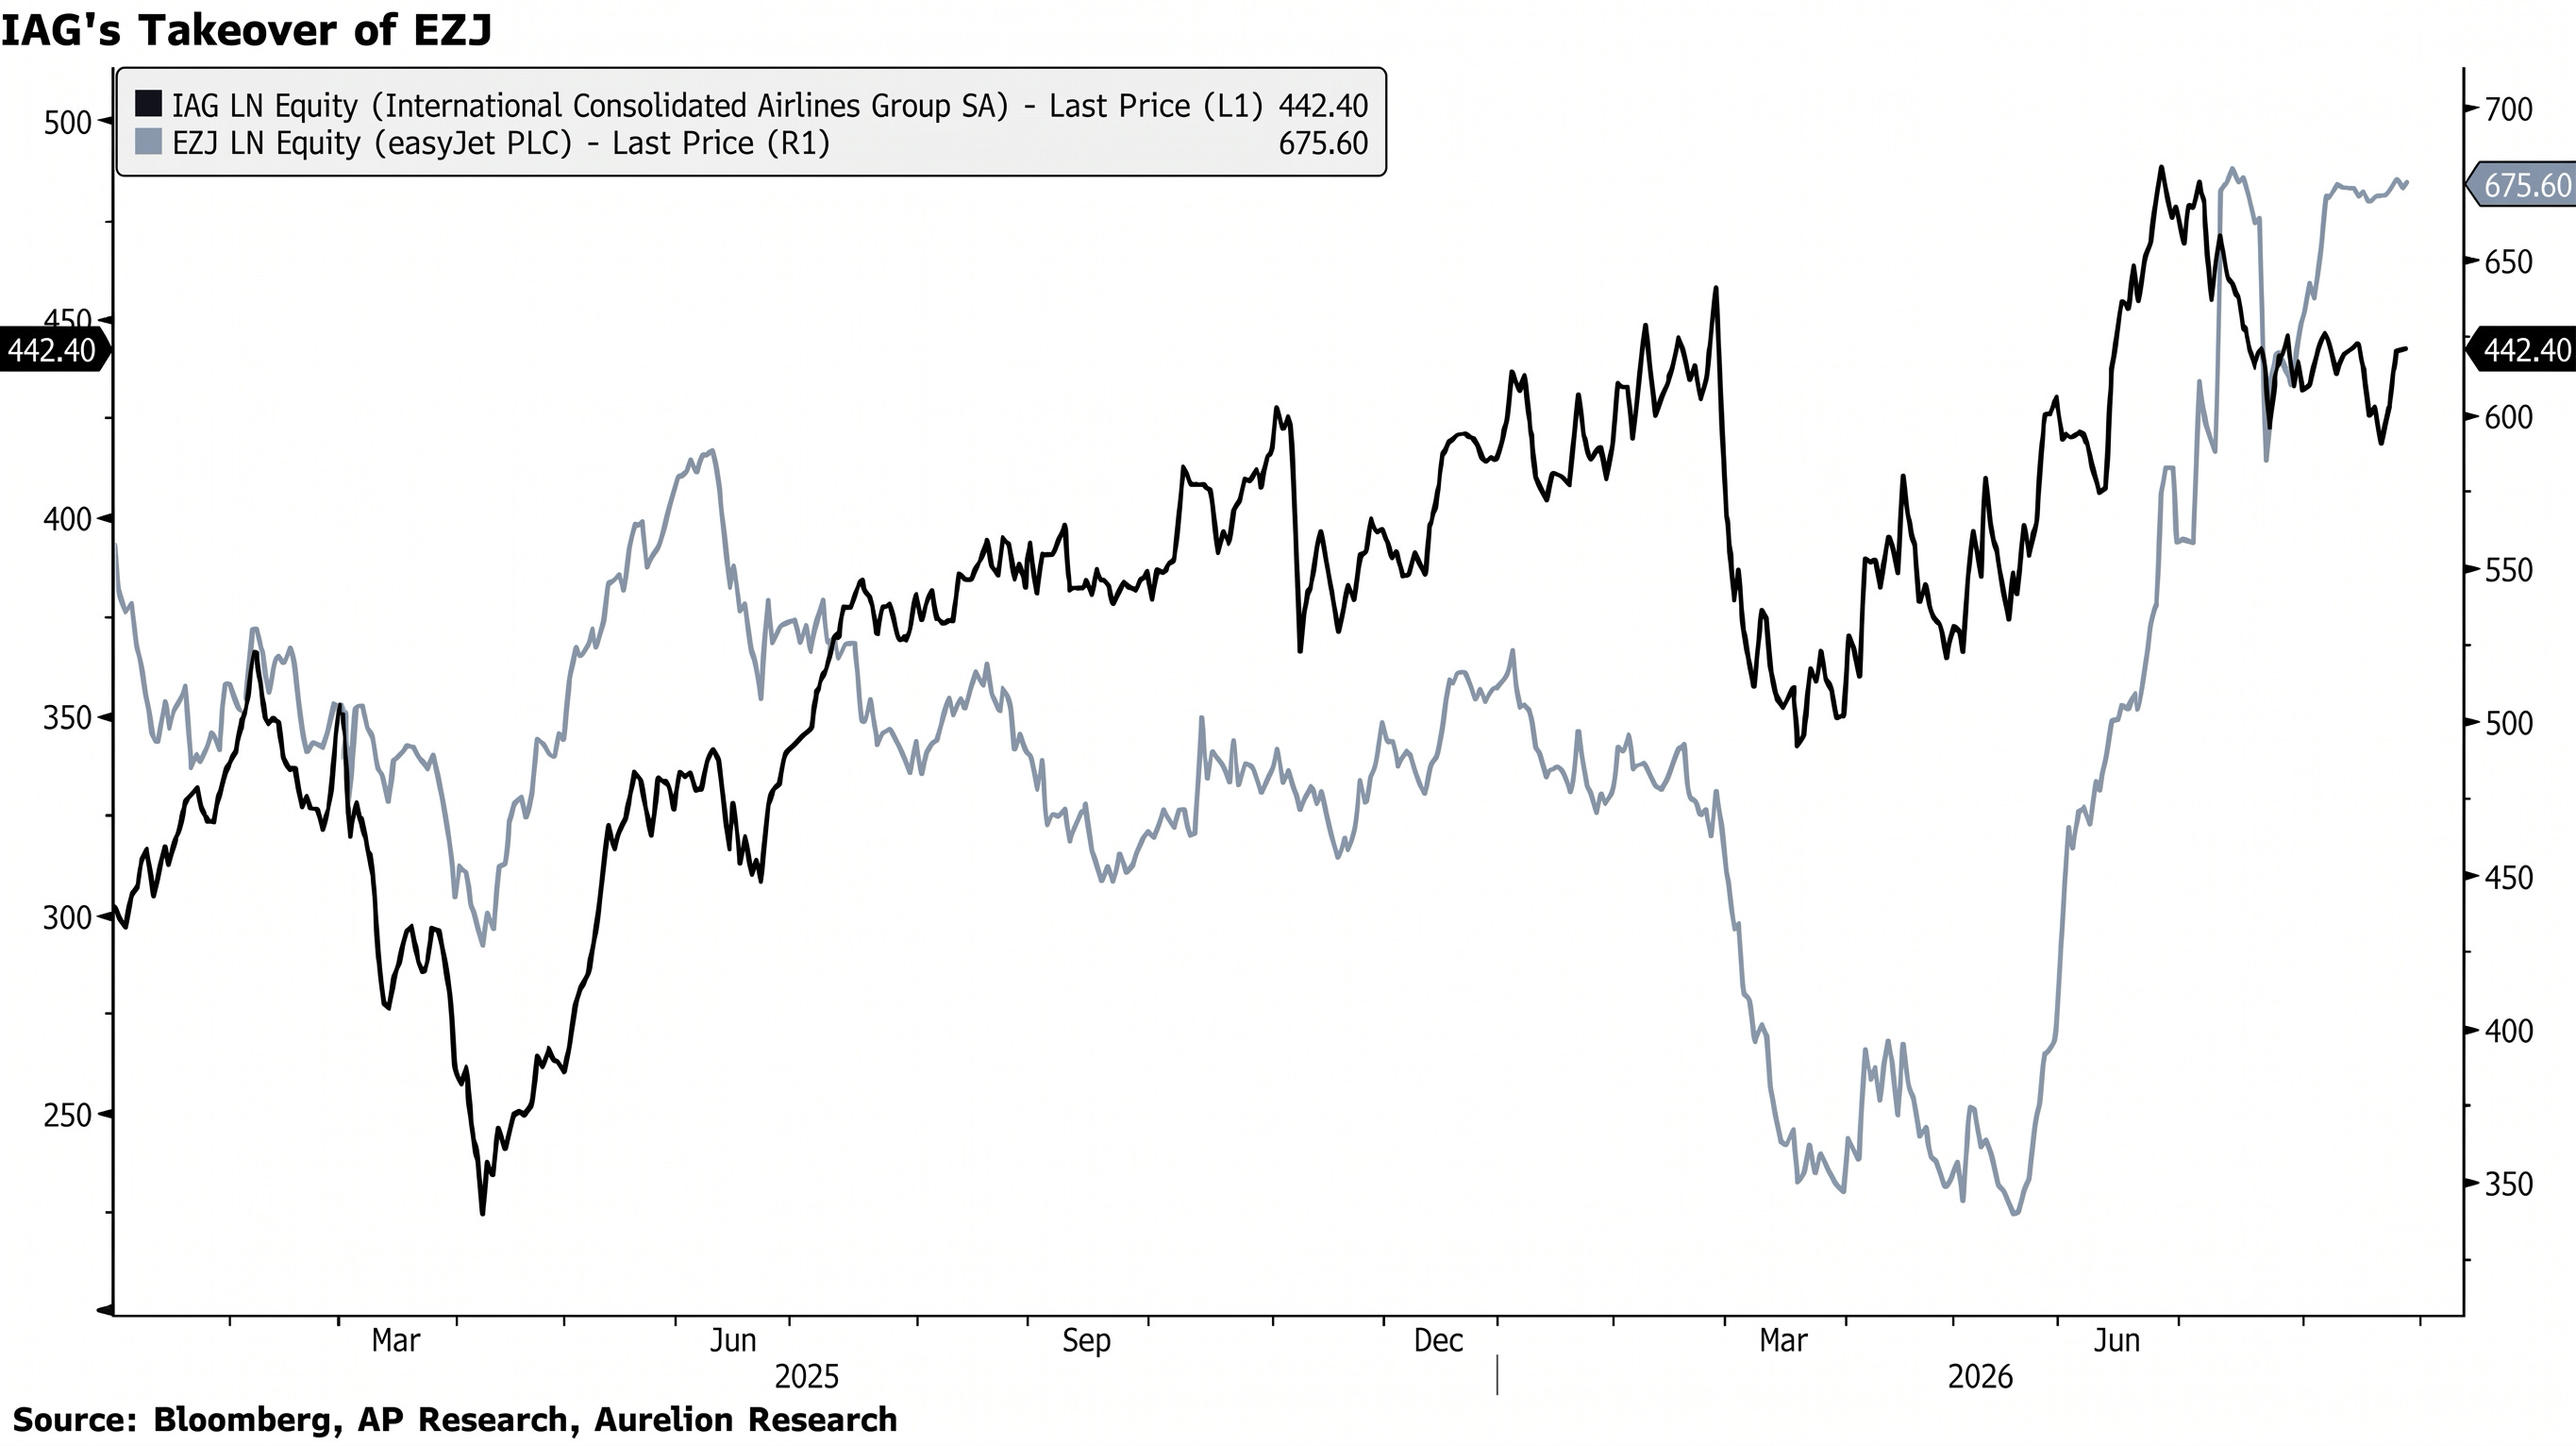
The stock is up 13% over the past year as travel demand has remained strong, profitability has improved, and the group has generated substantial cash. Yet it trades at roughly half the earnings multiple of Delta Air Lines, despite having a stronger balance sheet and higher ROCE. The underlying economics simply do not appear to justify such a large valuation gap.
The recent takeover of easyJet adds another interesting angle. Apollo Global Management has agreed to acquire the budget airline for £5.7bn, winning a months-long battle after rival Castlelake walked away.
Apollo is offering 715p per share in cash, an 81% premium to easyJet’s share price before takeover interest emerged. Like IAG, easyJet combines a strong balance sheet with valuable aircraft and airport slots, yet had previously traded at a low valuation.
For IAG, investors don’t need a takeover for the thesis to work. Continued earnings growth and strong cash generation should gradually close the valuation gap and support a higher multiple.
#2 Standard Chartered (STAN LN)
Standard Chartered generates the vast majority of its business outside Britain, particularly across Asia, Africa, and the Middle East. Yet its London listing has meant that it has historically carried the baggage associated with UK financials.
We believe DBS, the Singapore-listed bank, provides a useful comparison. Despite having broadly similar geographic exposure, Standard Chartered has traded at roughly a 40% valuation discount to DBS.
The fundamentals are also moving in the right direction.
H1 pre-tax profit reached a record $4.8B, RoTE rose to 17.6%, EPS increased 17%, and Wealth Solutions income jumped 38%.
Management also raised its revenue guidance.
4. Growth Driver 2: Political Capital
Andy Burnham entered Downing Street on July 20, 2026, promising a “new political model and a new economic model” after replacing Keir Starmer as Labour leader. The UK has become something of a political laughing stock in recent years, with Burnham becoming the country’s seventh PM in a decade.
Andy Burnham’s First Speech as Prime Minister

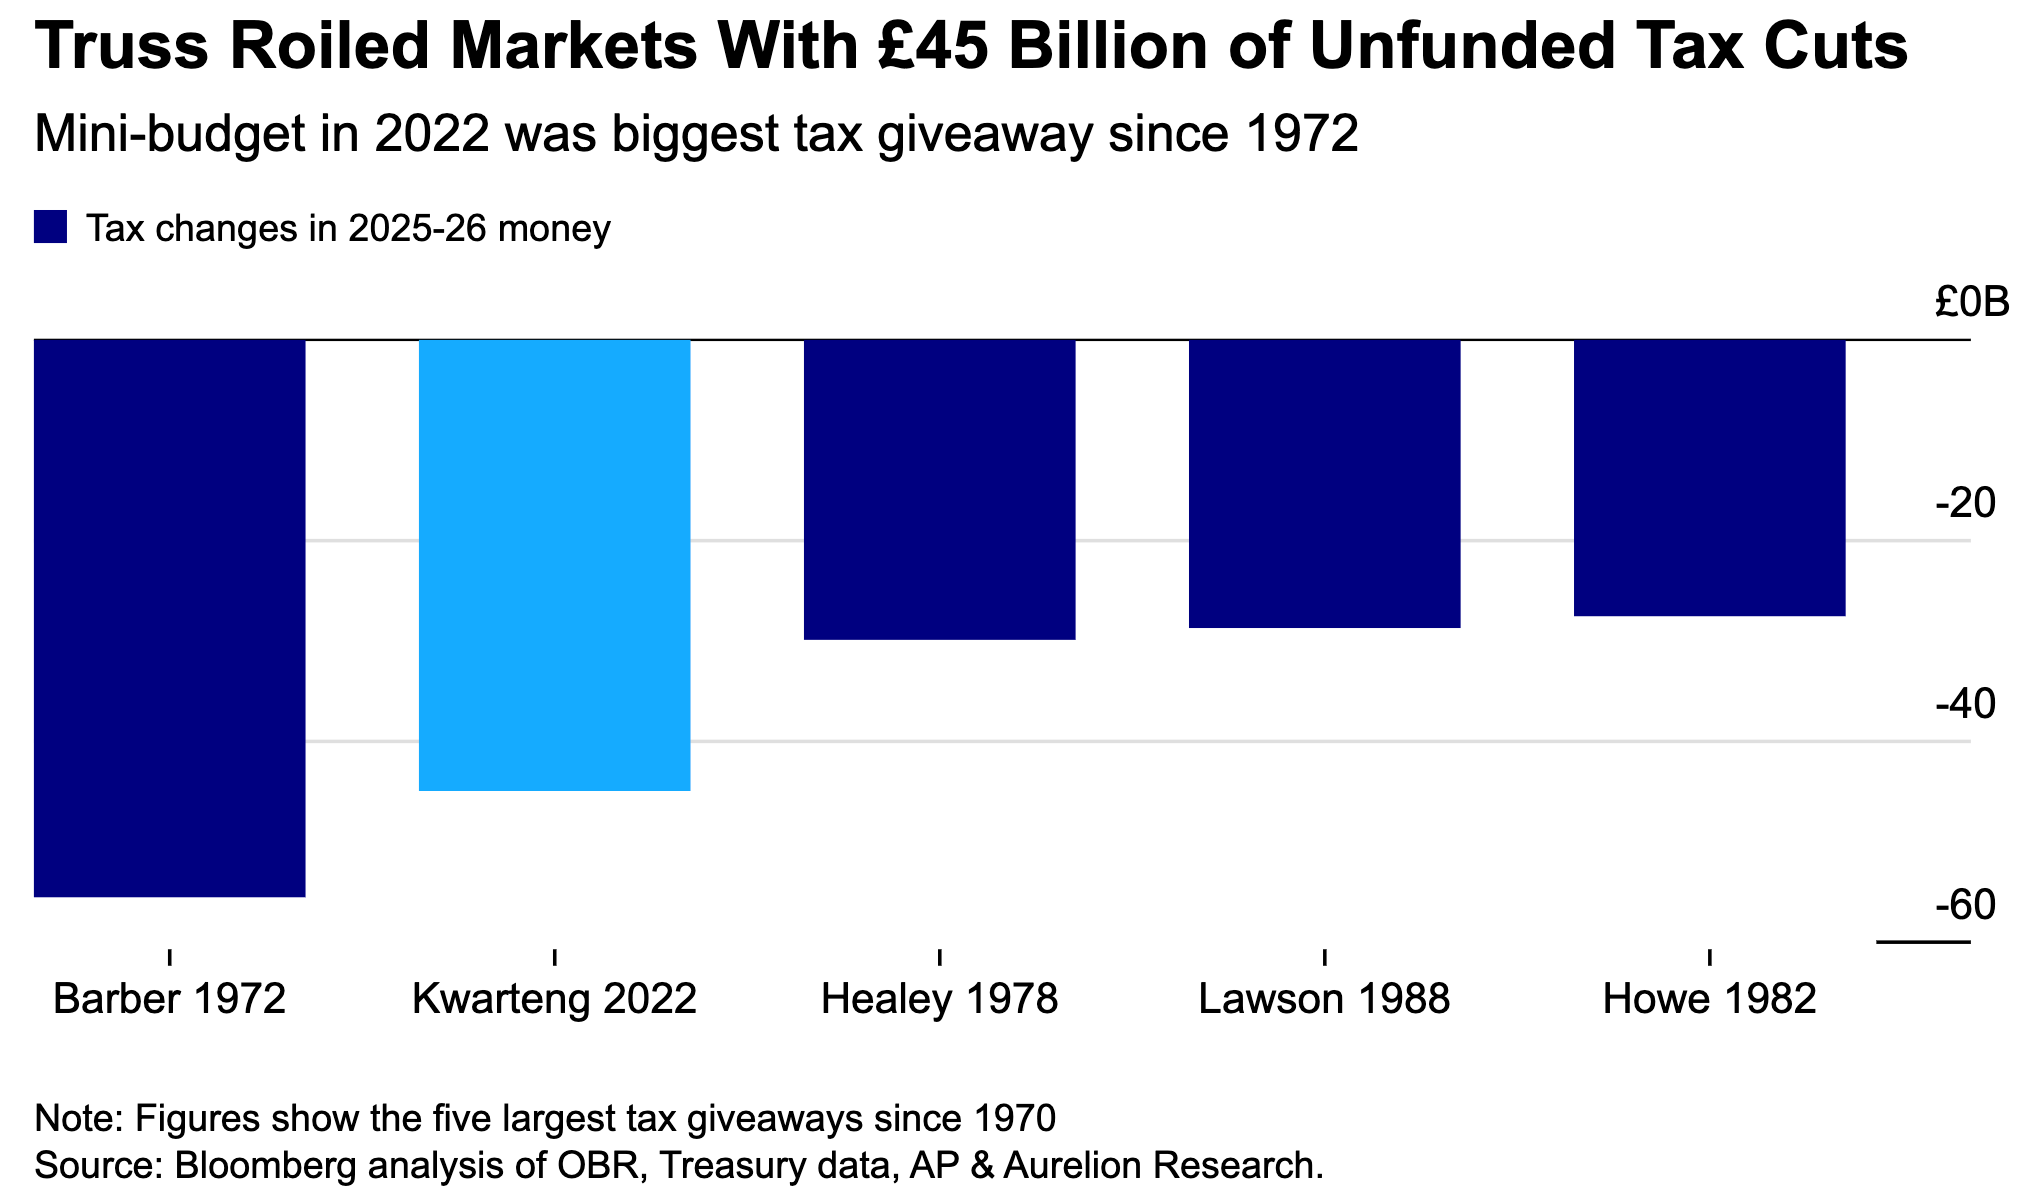
The consequences extended well beyond politics, with repeated fiscal missteps triggering serious market turmoil. The clearest example came in September 2022, when Liz Truss’s government, with Chancellor Kwasi Kwarteng, unveiled a mini-budget containing around £45bn in unfunded tax cuts.
Markets reacted badly, with gilt yields surging and severe pressure building across pension funds, particularly those using liability-driven investment strategies. To prevent the stress from turning into a broader financial crisis, the Bank of England stepped in with a temporary programme to buy long-dated gilts, initially offering up to £65B in purchases. In the end, it bought £19.3B of gilts before gradually unwinding the entire position once market conditions stabilised.
Even though this shows the damage that can be done, the opposite is also true. Burnham does not need to transform productivity overnight.
He needs to convince companies and investors that the direction of travel has changed, that approved projects will actually be delivered, and that domestic capital will no longer be encouraged to bypass UK assets.
In a market priced for disappointment, simply reducing policy uncertainty can be almost as valuable as an immediate improvement in earnings. Before we even get to the policies, there are already some positive signs. Labour is now polling ahead of Reform UK, the right-wing alternative in the UK’s increasingly fragmented political landscape. The recent improvement largely reflects growing confidence that Burnham can deliver the change he has promised.
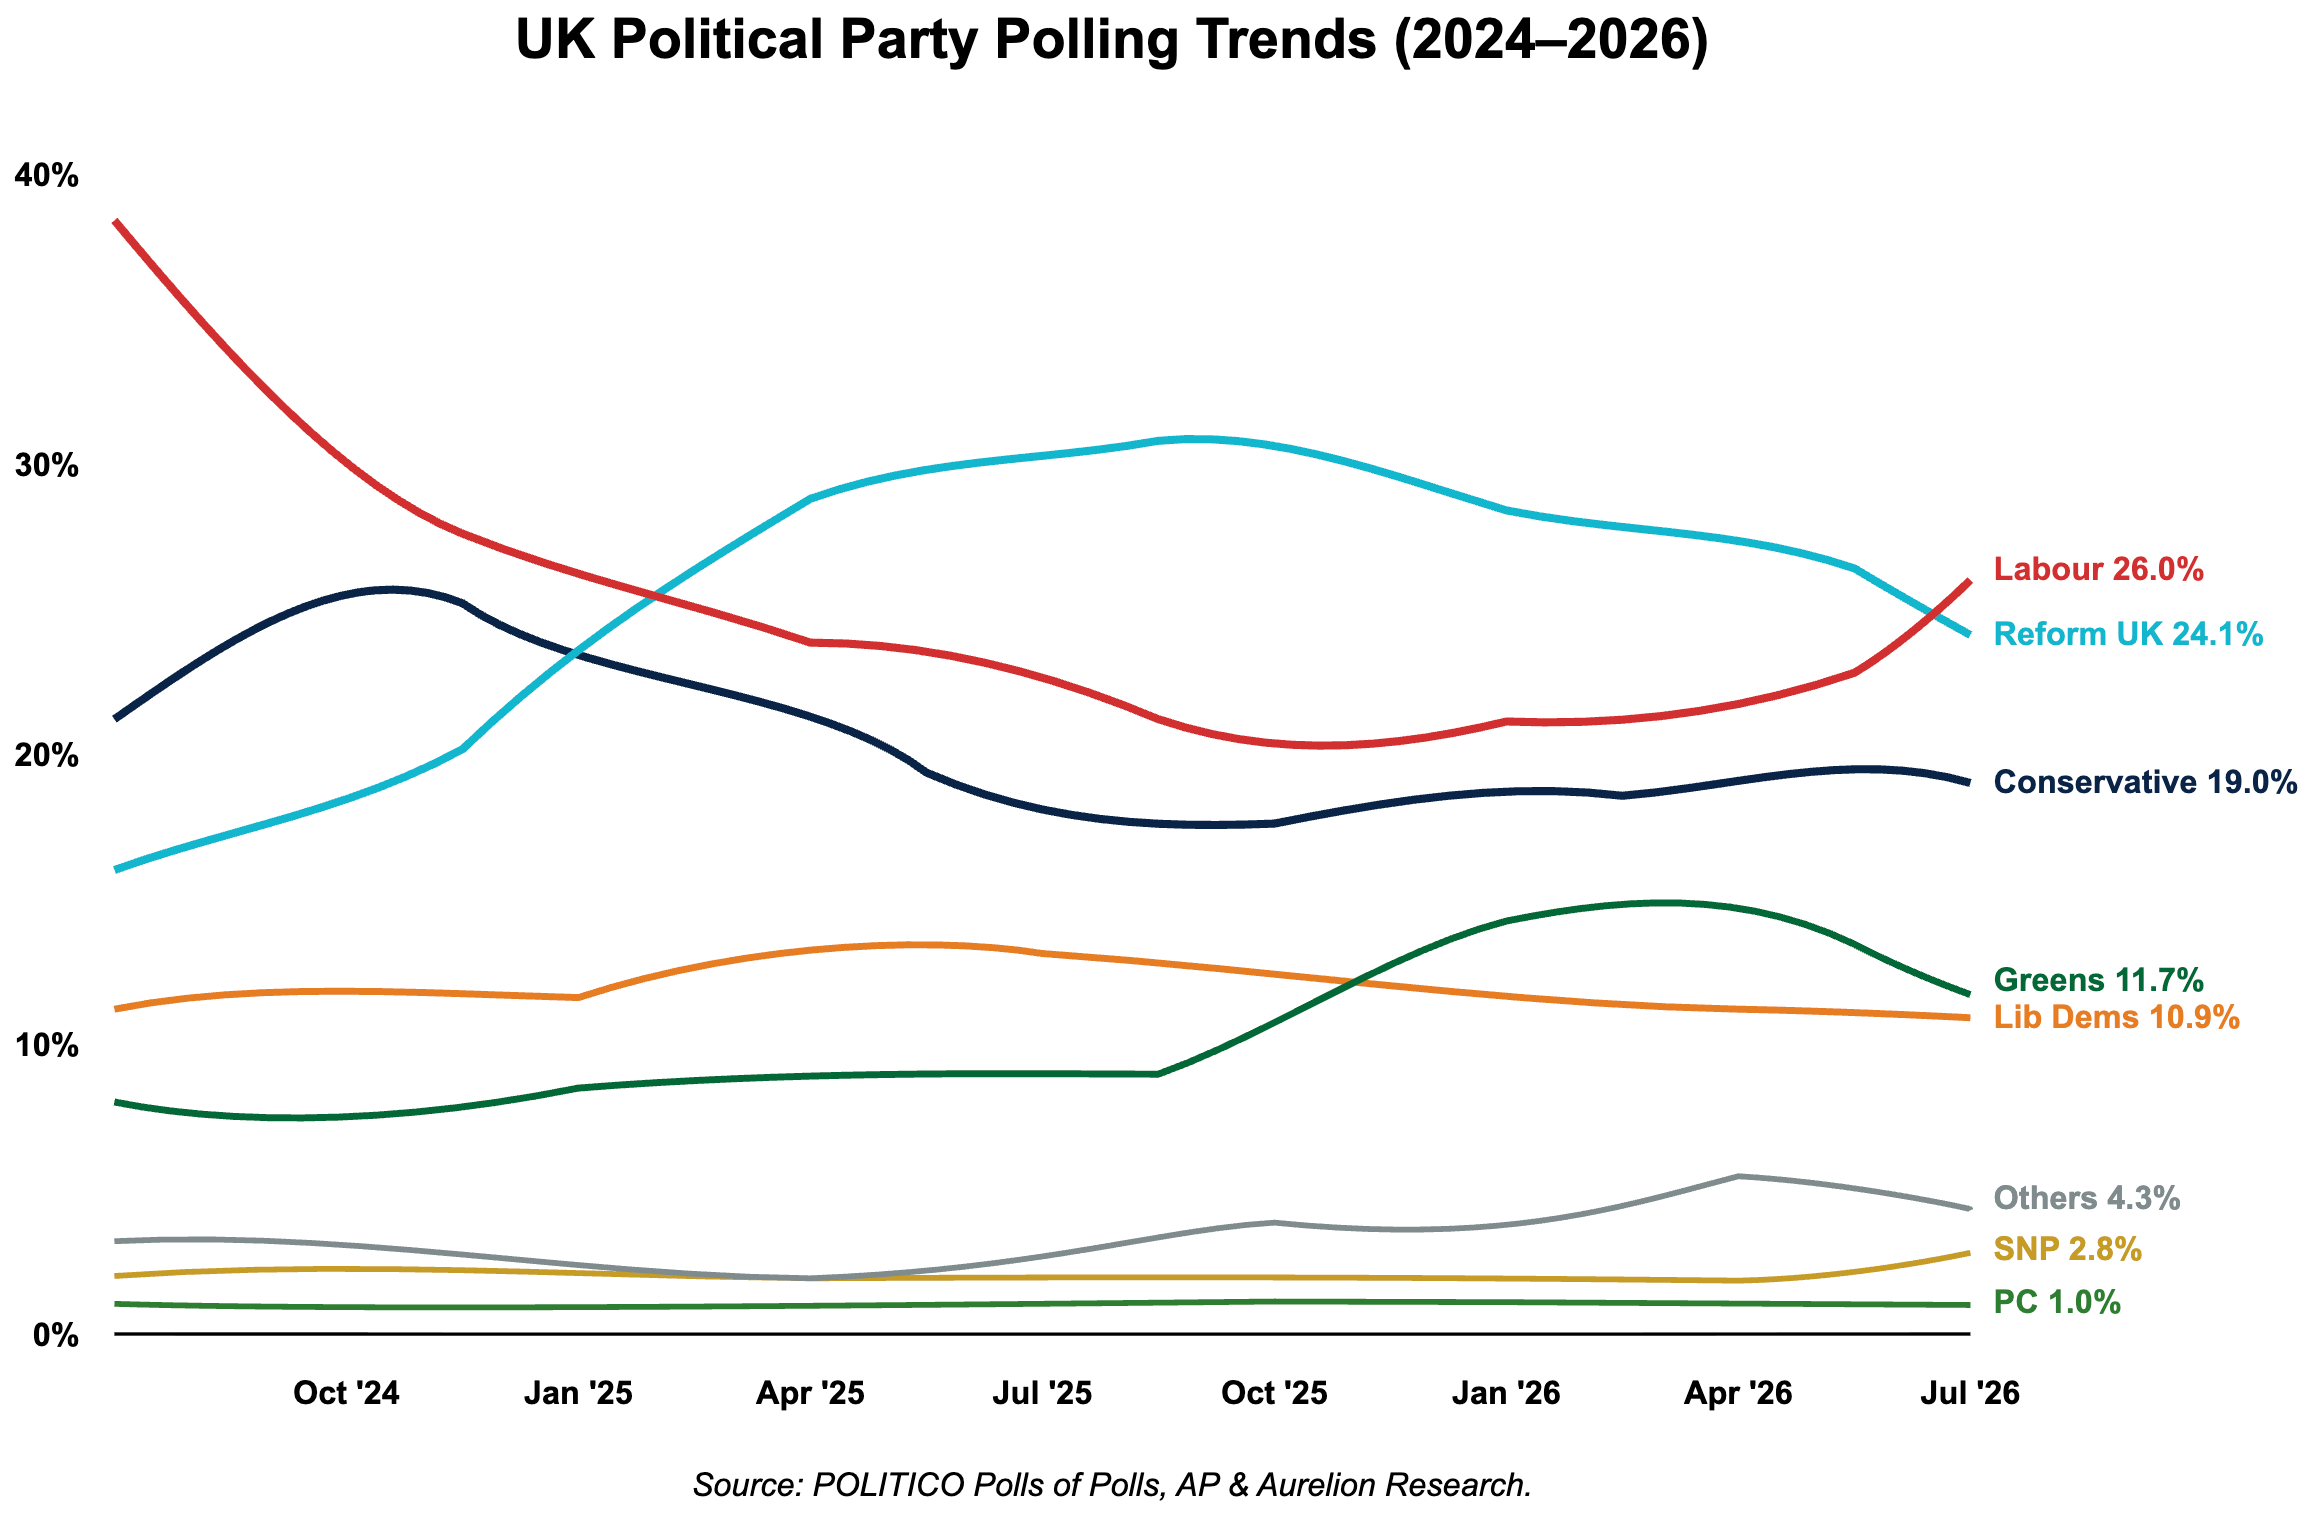
What has been more constructive is the absence of a sustained fiscal-risk spiral. The 10-year Gilt yield is now 4.85%, below its level when Burnham took office.
Of course, yields remain high in absolute terms, but the market has so far treated Burnham’s programme as a conventional fiscal debate rather than a broader credibility issue. So, what policies could drive this change, and which sectors should we watch? One of the most interesting levers is savings reform.
UK workplace defined-contribution (DC) pensions held roughly £600bn in assets in 2023, but only 6% was invested in UK equities, compared with 70% in overseas equities. The domestic share of DC assets has also fallen from just over 50% in 2012 to just over 20% today.
The government’s own analysis estimates that a five-percentage-point increase in domestic DC allocation would add £30bn of investment into UK markets. At the same time, ISA reform will reduce the under-65 Cash ISA allowance to £12,000 from April 2027, while keeping the overall £20,000 ISA allowance unchanged. The goal is clear: encourage more savings to flow into investment products.
Given how little the current ISA and pension system supports UK equities, this growth driver does not require a dramatic change. From our calculations, a one-percentage-point increase in DC home bias, a modest shift in ISA cash savings, and a half-percentage-point increase in LGPS listed-equity allocation could generate roughly £6.7bn of incremental demand for UK-listed equities. The impact could be particularly meaningful for the much smaller FTSE 250.
Pinpointing exactly which stocks would benefit is harder. These funds would act as marginal buyers, making the impact difficult to trace directly.
However, we see two clear points.
First, money is likely to flow toward companies seen as undervalued. This supports the first growth driver we discussed above and could help close some of the valuation gap.
Second, it matters less where all the money ultimately ends up, as much of it will pass through UK asset managers, brokerage platforms, insurers, and other financial institutions. These businesses should benefit from higher AUM, greater trading activity, and increased demand for actively managed products.
There are, of course, other ways to play these reforms, such as homebuilders benefiting from potential housing reform or retail and leisure companies benefiting from measures aimed at easing the cost of living.
But if we want direct exposure to the financial reforms themselves, we believe UK financials offer one of the most attractive risk/reward opportunities.
#3 Legal & General (LGEN LN)
We like Legal & General as a clean way to play the potential shift in British savings towards British assets. The scale is already significant, with the group managing around £1.2tn globally, while its defined-contribution pension business oversees more than £180bn.
Workplace DC AUM reached £114bn at the end of 2025, up 21%, after attracting £6.2bn of net flows during the year.
As a result, Legal & General should benefit from increased flows, whether through higher pension allocations to UK equities, infrastructure, or private assets. All of these could support AUM and fee income across its asset-management business, where private-markets AUM already reached £75bn in 2025, up 32%.
We think of LGEN as a toll road on the flow of British capital. If the UK succeeds in redirecting more domestic savings into UK assets, Legal & General should be one of the companies collecting fees along the way.
#4 Jupiter Asset Management (JUP LN)
Jupiter Fund Management could be an even more direct way to play a revival in domestic investment flows. Unlike a diversified insurer such as Legal & General, Jupiter’s business is closely tied to assets under management, investment performance, and client flows.
If Burnham’s reforms encourage British savers and pension funds to put more money into investment products, particularly UK equities, Jupiter should be well positioned to capture part of that shift.
Importantly, the turnaround is already gaining momentum.
Jupiter’s AUM reached £73.7bn at the end of June 2026, up 36% from £54bn at the end of 2025, helped by the CCLA acquisition, investment performance, and another £700mn of net inflows. Net revenue rose 39% to £213.3mn, while underlying pre-tax profit jumped 67% to £50.7mn.
The flow picture is particularly relevant to our UK thesis. In 2025, Jupiter recorded £1.3bn of net inflows, its first positive calendar year since 2017, compared with a staggering £10.3bn of outflows in 2024.
Crucially, UK equities were among the strategies attracting positive flows, including the UK Dynamic and UK Growth franchises.
5. Growth Driver 3: Index Composition For The Next Cycle
The lack of AI and broader technology companies in the UK public market is no secret. In theory, this should have caused the UK to lag the S&P 500 even more, given the huge contribution from tech and AI-related stocks.
Yet that has not been the case this year.
YTD, the FTSE 100 is up 8%, compared with 12% for the S&P 500.
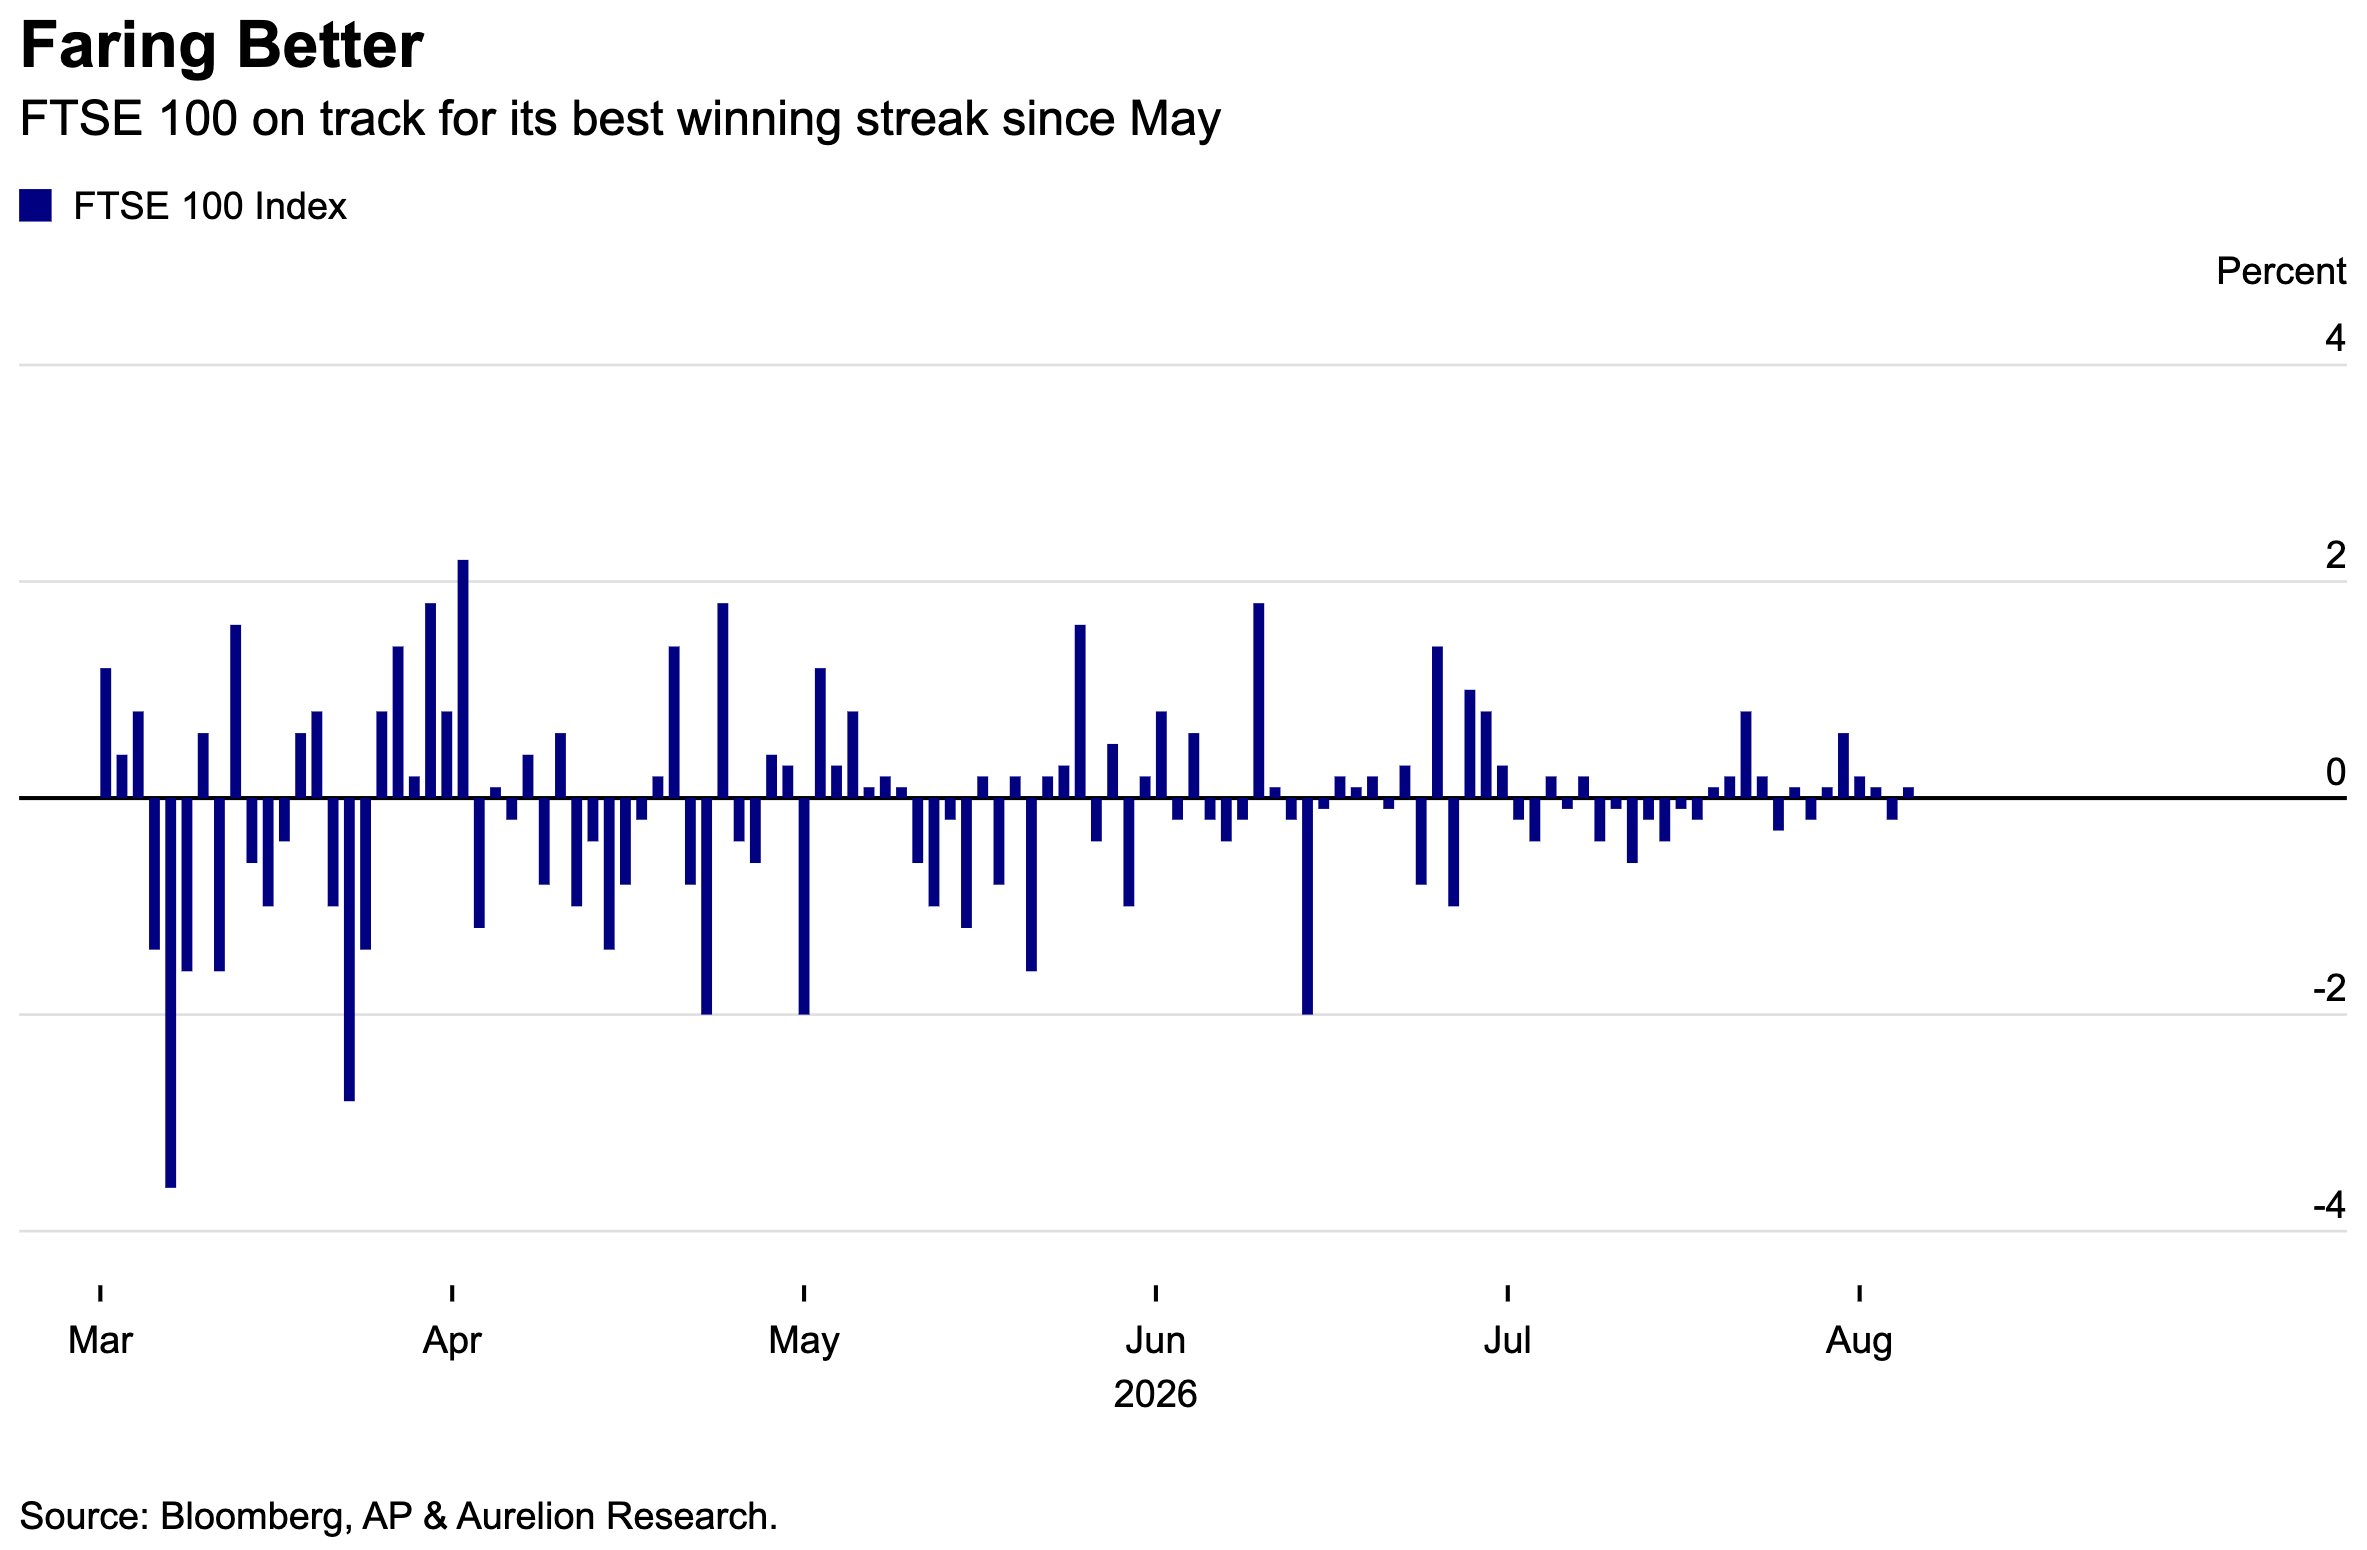
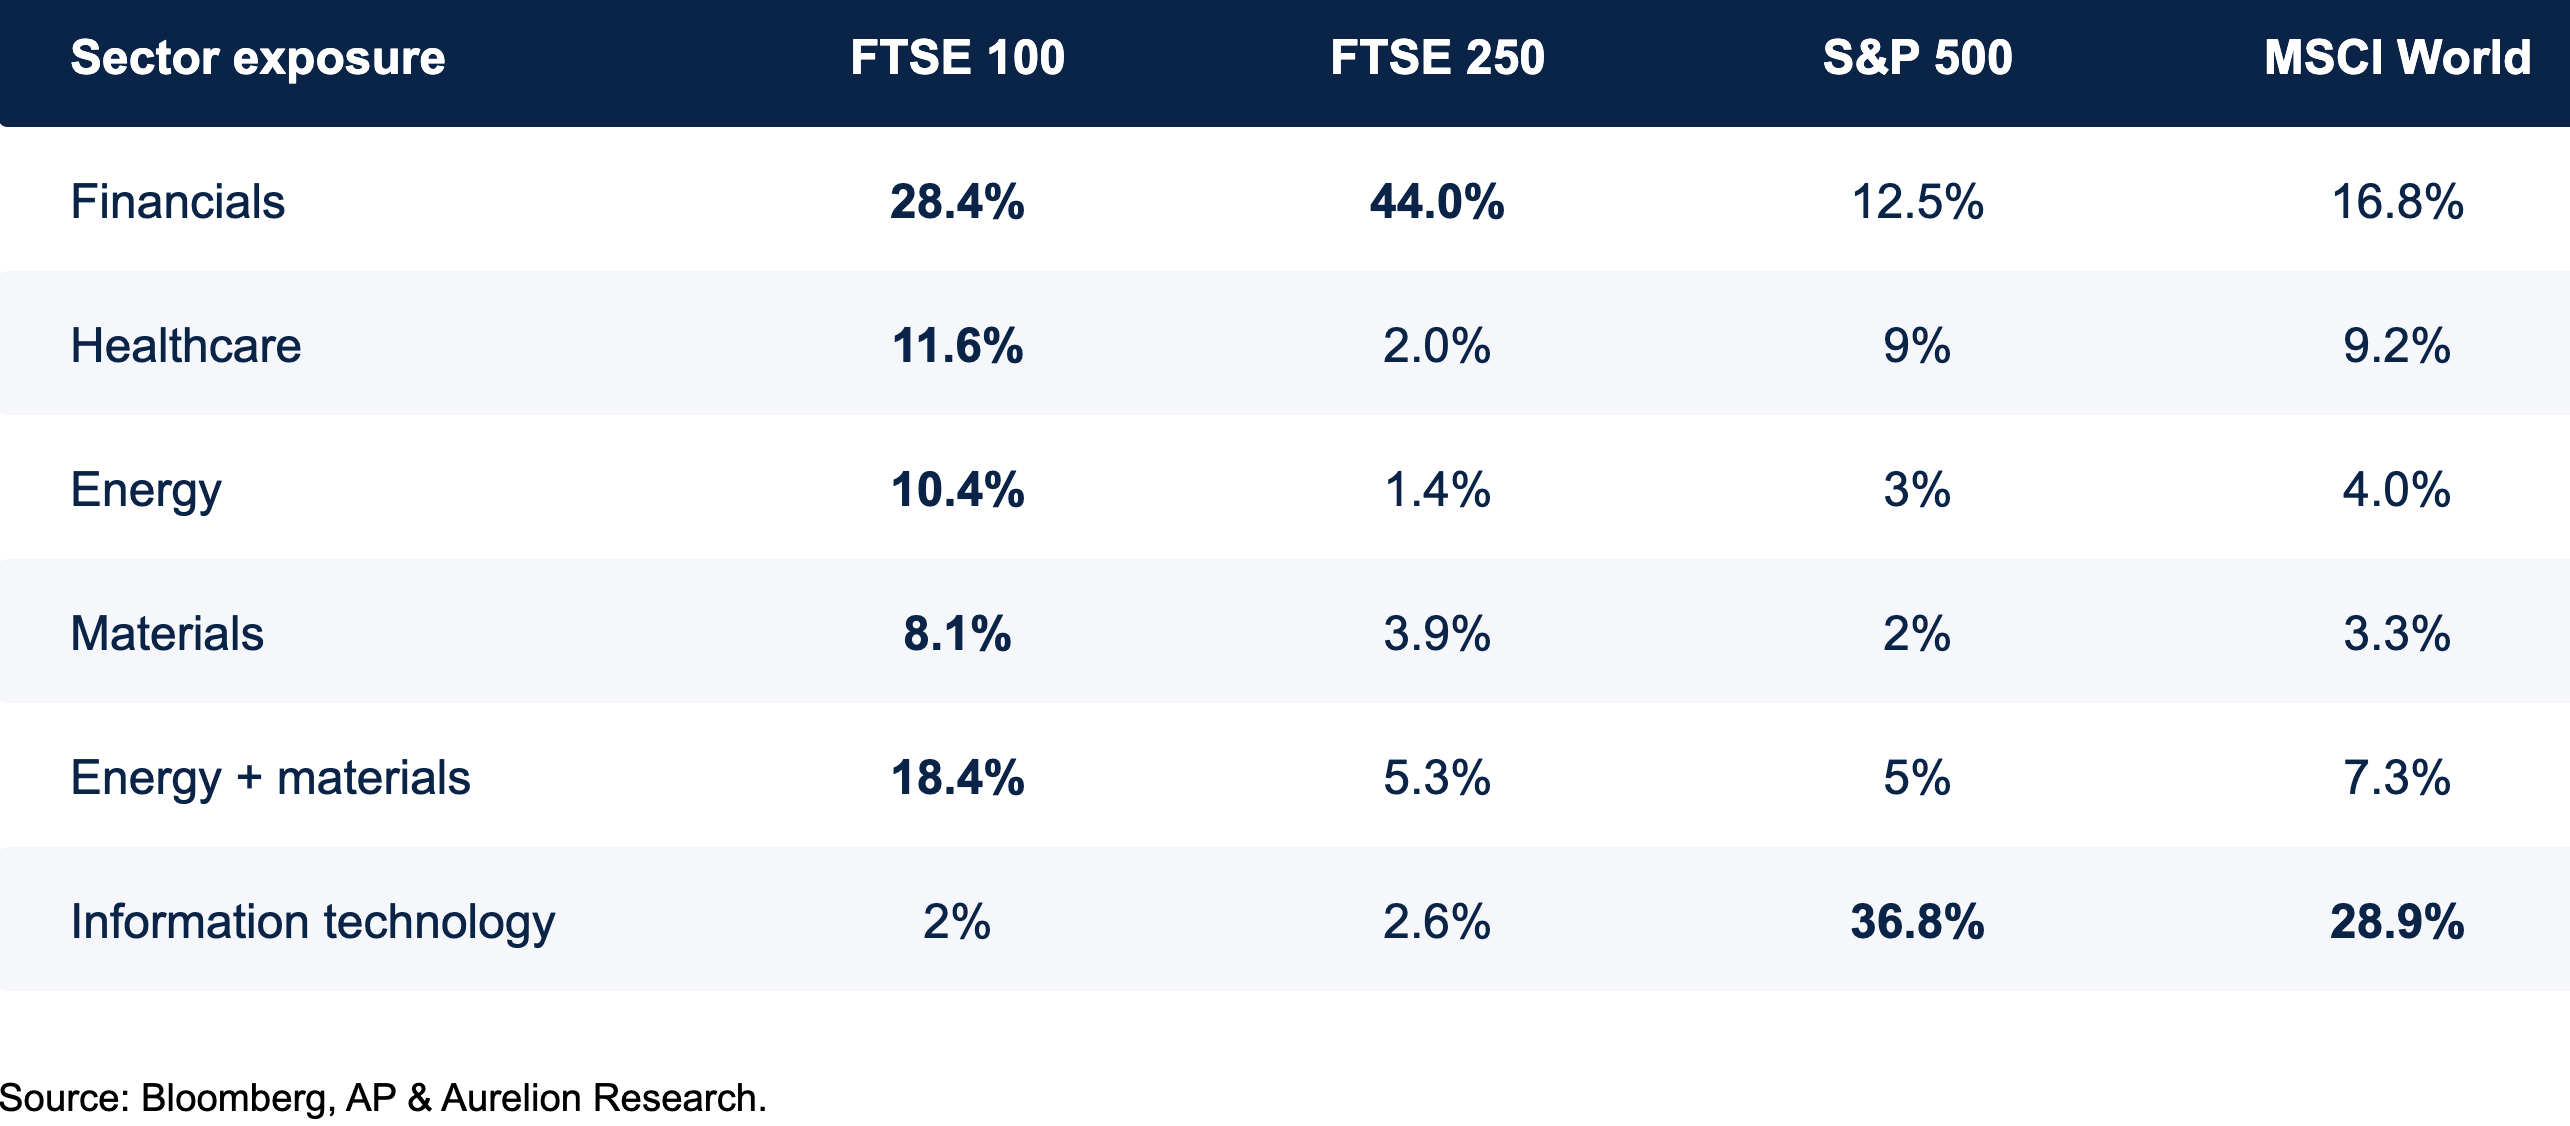
Ironically, one factor supporting the UK market is its index composition. While the FTSE 100 has little exposure to technology, it has large weightings in sectors that are already performing well. Financials account for roughly 28% of the index, followed by healthcare at 11.6%, energy at 10.4%, and materials at 8.1%.
The contrast with the US is significant.
Information technology alone represents 36.8% of the S&P 500 and 28.9% of the MSCI World. This means the UK offers investors a very different mix of sector exposure, with greater weightings toward financials, healthcare, energy, and materials, all areas where we see strong potential in the next cycle.
So why does this setup look appealing going forward? Let’s focus on three sectors we are bullish on right now: financials, healthcare, and energy.
5.1 Financials
UK banks have performed strongly over the past year as the interest-rate backdrop has remained far more supportive than many investors initially expected. The Bank of England held its policy rate at 4% through much of 2025 before cutting by just 25bps to 3.75% in December, where it has remained.
This has allowed banks to maintain healthy net interest margins and deposit spreads. Looking forward, we see this continuing based on our macro outlook for monetary policy. The BoE held its policy rate at 3.75% at its July 2026 meeting, with a 6-3 vote and three MPC members voting for a hike.
Current market pricing indicates X bps of rate hikes are priced in through year-end. A “higher for longer” scenario, or even a modestly higher rate path driven by energy price inflation and Middle East tensions, would be incrementally positive for bank NIMs.
Importantly, the benefits of higher rates have increasingly been reinforced by fundamental hedges. Barclays, Lloyds, and NatWest have large hedge books that gradually roll onto higher yields, providing a delayed boost to net interest income even if the BoE cuts rates modestly. All three have guided towards year-on-year growth in fundamental hedge income over the medium term, making the earnings benefit more durable than simply relying on rates staying high.
When you put it all together, it’s clear that the full benefit of this cycle has yet to be reflected in earnings.
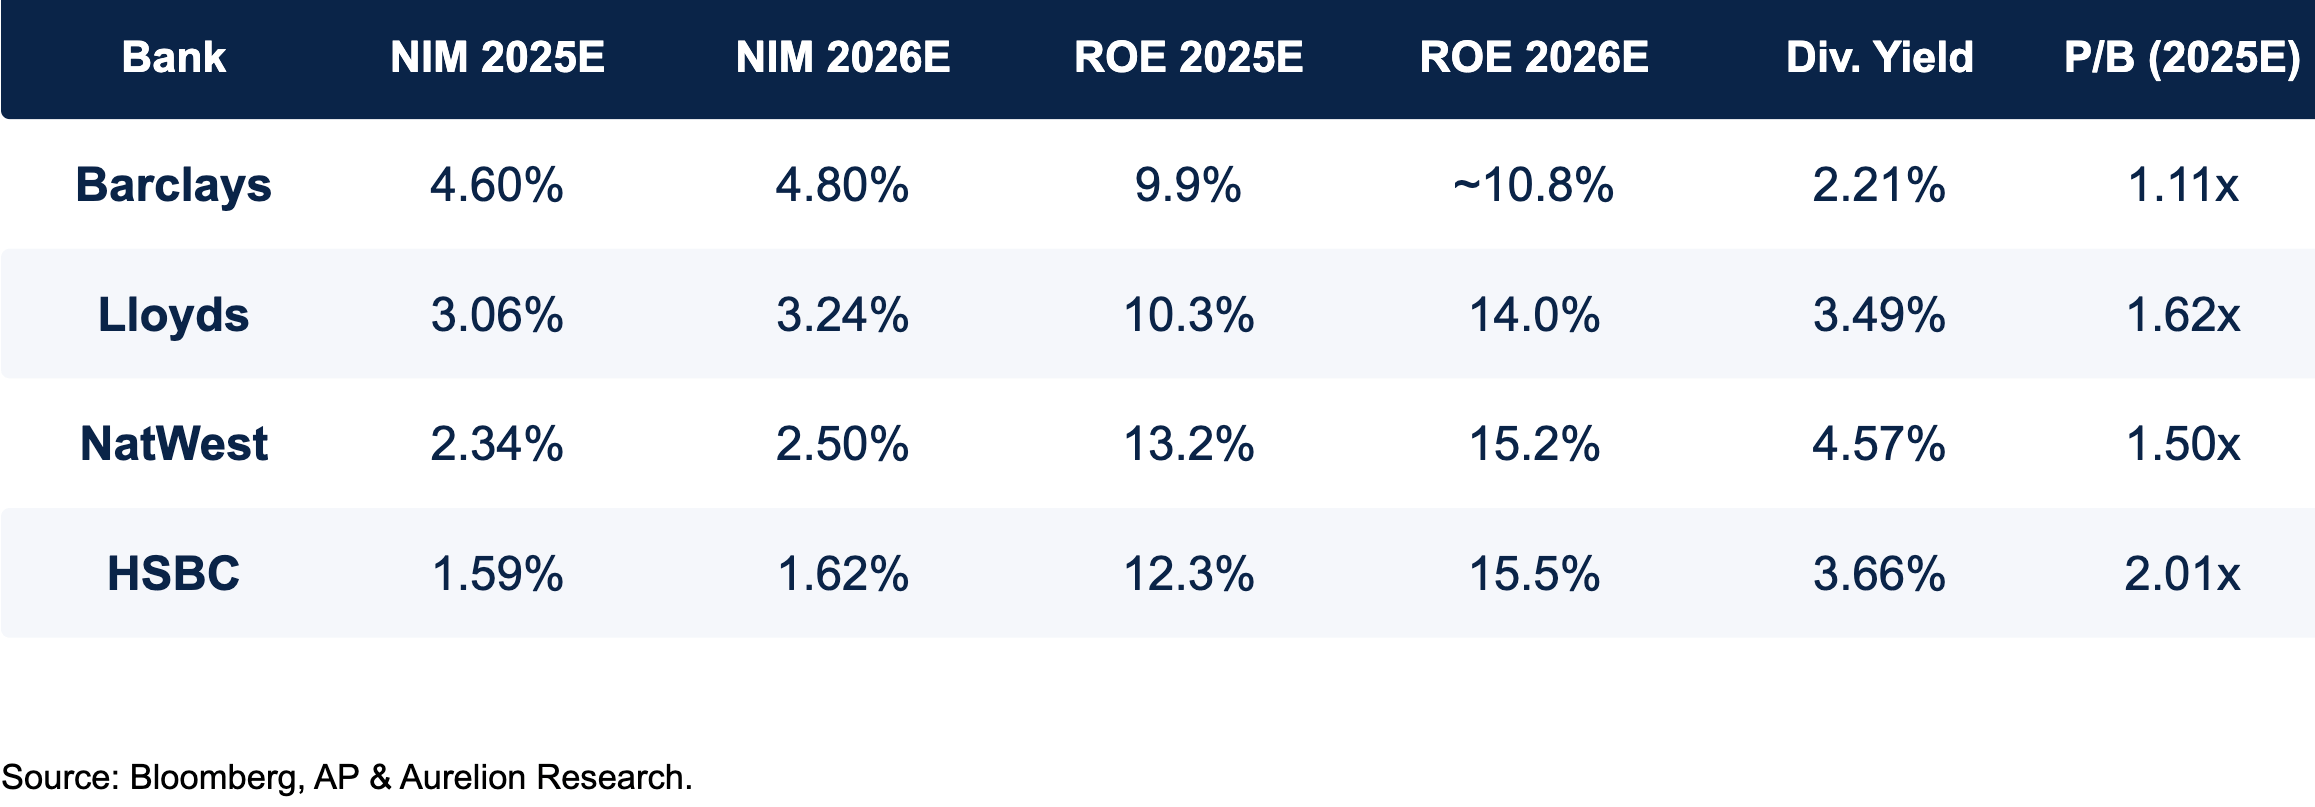
The next leg of this cycle could come from a further re-rating of the sector alongside supportive monetary policy. Investors are increasingly recognizing that the improvement in profitability since Covid is more fundamental and not simply the result of higher rates. With UK banks still trading within a domestic equity market that remains heavily discounted versus other developed markets, stronger returns and better earnings visibility could give investors a good reason to close at least part of that valuation gap.
5.2 Energy & Materials
Over the past 12 months, UK materials stocks (FTSE 100 members) delivered a total return of +80%, while energy stocks returned +34%. Materials were the standout sector across the entire index, comfortably ahead of even Technology (+55%) and Financials (+26%).
The main driver has been the broad rally in commodity prices over the past year, with the Iran war acting as a key catalyst. However, it would be wrong to attribute all of these gains to the oil complex.
In fact, copper has been the strongest performer across the major commodities, rising 44% on supply deficits and recovering Chinese demand.
Next is Brent crude, up 34%, driven higher by the Iran conflict and related disruptions to maritime trade. Gold is slightly behind at +32%. While it struggled for much of Q2, it remains supported by central bank buying, a weaker US dollar, and safe-haven demand. Not all commodities have performed equally, however, with natural gas (-1%) and iron ore (-7%) standing out as notable laggards.
Looking ahead, we don’t believe this is the end of the road for materials outperformance, even with precious metals having pulled back in recent months.
Copper is a good example. Physical copper markets are likely to remain in deficit in 2026, as production growth cannot keep pace with rising consumption, supporting further price increases. Copper is forecast to average $12,800/t in 2026, with demand supported by China’s power grid, renewable energy, EVs, and machinery, while supply remains constrained.
More importantly, we expect the copper deficit to persist well beyond 2026, creating a longer-term supply problem for the market.
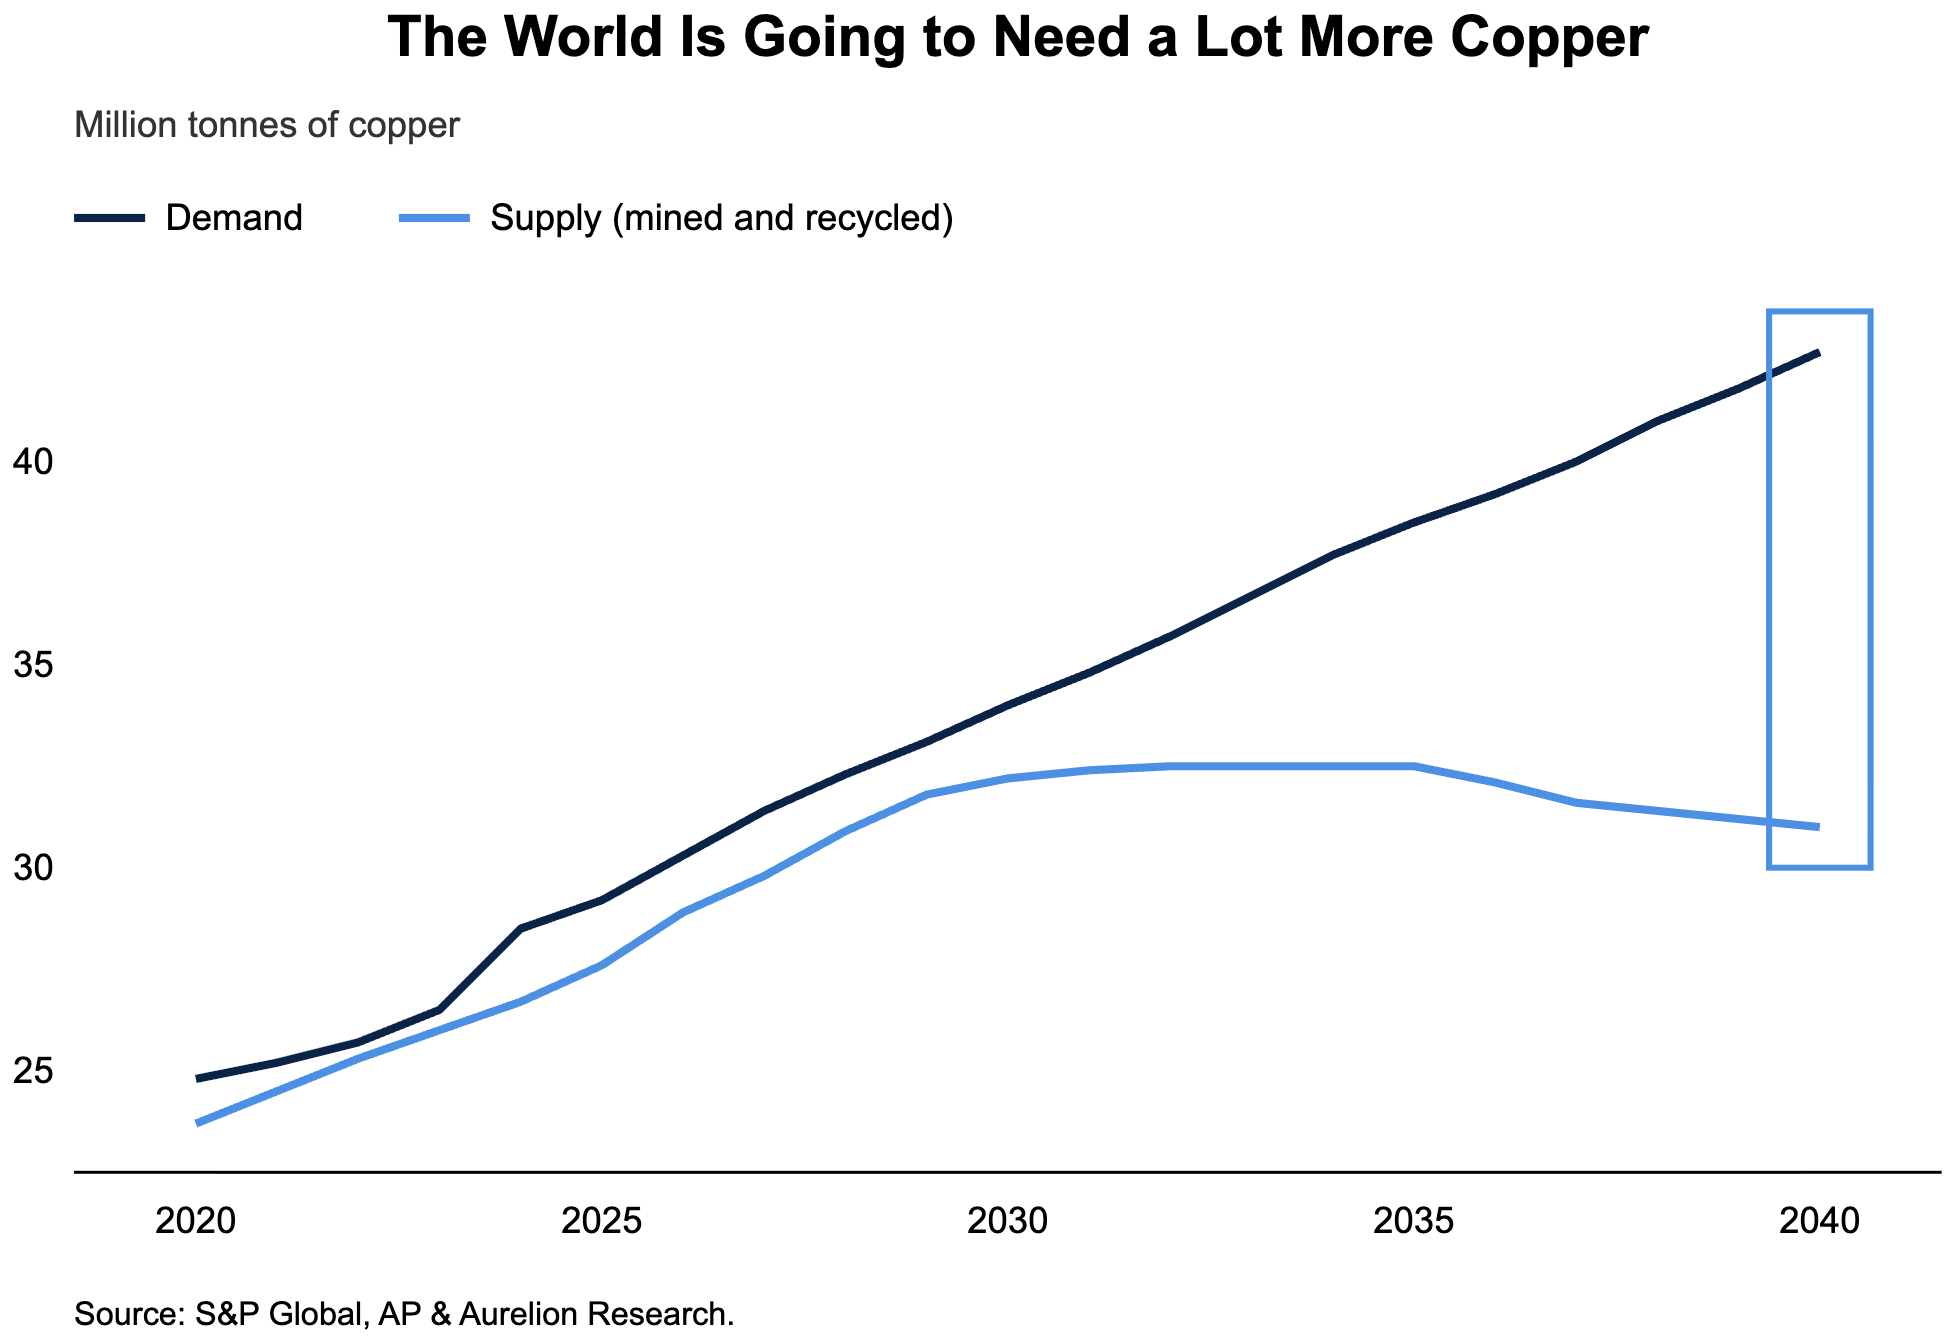
The fundamentals are highly compelling. A decade of underinvestment, combined with the rising capital intensity of new projects, means higher prices will likely be needed to incentivize new supply. This is already reflected in the FTSE 100, with the Anglo American–Teck merger moving towards completion and expected to create the world’s leading listed copper company.
Copper isn’t the only metal expected to face a deficit over the coming year. Aluminium is another market where the supply picture looks increasingly tight. Middle East disruptions are estimated to have caused 3.5–4.0 Mtpa of outages, with around 2M tonnes of regional supply expected to be lost in 2026. If these disruptions continue, aluminium prices could move above $4,000/t.
Regarding gold and silver, we believe the recent pullback offers a good opportunity to buy the dip. More broadly, UK energy and materials stocks still trade at low valuations despite their strong performance.
The median forward P/E is 10.5x, while median forward EV/EBITDA is 4.7x. If commodity prices stay high, we believe these stocks still have room to move higher as earnings grow and valuations improve.
#5 Anglo American (AAL LN)
Anglo American is particularly compelling given our bullish outlook for copper.
The group’s transformation is rapidly concentrating the business around the red metal, with its merger with Teck expected to create a top-five global copper producer. More than 70% of the combined business will be exposed to copper, with production of around 1.2M tonnes annually, potentially rising to 1.35M tonnes by 2027.
The combination also targets $800mn of recurring annual pre-tax synergies, while optimization of the neighbouring Collahuasi and Quebrada Blanca mines could eventually add another 175,000 tonnes of annual copper production and around $1.4bn of average annual EBITDA.
That leaves Anglo unusually leveraged to our view that copper deficits can keep prices elevated. In terms of recent performance, higher copper prices helped H1 2026 underlying EBITDA jump 35% to $4bn, while net debt fell to $8.2bn.
#6 Fresnillo (FRES LN)
Another precious metals play is Fresnillo, given that it is the world’s leading primary silver producer and one of Mexico’s largest gold producers.
We have already seen its operating leverage at work following last year’s precious metals rally, which carried into H1 2026. Revenue surged 74.7% to $3.4bn, while gross profit jumped 130.7% to $2.4bn as the group benefited from historically strong gold and silver prices.
The attraction now is that our thesis does not require another explosive move in gold and silver. Fresnillo remains on track to produce 42–46.5M ounces of silver and 500–550koz of gold in 2026, giving us significant exposure if precious metals simply remain at high levels.
If production stabilizes while gold and silver continue to move higher, Fresnillo could benefit from both stronger operating performance and higher commodity prices, leaving earnings with considerable room to surprise on the upside.
5.3 Healthcare
The case for UK healthcare stocks is becoming increasingly attractive following a prolonged period of neglect. The sector has faced real headwinds, both in the UK and globally, including drug-pricing reforms and reimbursement pressure.
There have also been concerns that AI could reduce rather than improve margins. These factors have led investors to use healthcare as a source of funding for more popular AI and tech names, leaving positioning in the sector unusually light.
We believe this neglect is now part of the opportunity, especially given the UK’s limited exposure to healthcare. Valuations also look reasonable relative to the broader market. The FTSE 350 trades at an average forward P/E of 15.2x, while GSK trades at 10.4x and Hikma at 9.6x. On a P/B basis, versus a 3.5x average for the FTSE 350, Smith & Nephew trades at 2.4x and Hikma at just 1.9x.
Positioning also remains far from crowded, meaning even a modest rotation away from expensive tech names could provide a meaningful boost to healthcare stocks.
The fundamentals offer another reason for optimism. Healthcare companies typically benefit from strong pricing power, high margins, and limited exposure to commodity inflation. An improving earnings environment could therefore create meaningful operating leverage as margins recover. Meanwhile, healthy balance sheets and the need for large pharmaceutical companies to replenish their drug pipelines could support further M&A, particularly across biotech.
We also think the AI angle is under-appreciated.
Investors have largely focused on AI as a threat to healthcare margins, but productivity gains in areas such as drug discovery, diagnostics, and administration could eventually create meaningful upside to earnings.
#7 Hikma Pharmaceuticals (HIK LN)
If one stock looks well placed to play our view that healthcare’s period in the wilderness could be coming to an end, it’s Hikma.
The business has considerable defensive qualities while still offering meaningful growth potential. It is also now the largest pharmaceutical company by sales across its MENA markets and the third-largest US supplier of generic injectables by volume.
That combination of scale and margins fits well with our broader thesis. Healthcare’s pricing power and relatively low exposure to commodity costs should provide resilience if inflation remains a problem, while its increasingly differentiated portfolio offers another source of growth.
Its Injectables pipeline contains 118 products, including 15 ready-to-use formulations, while investment in complex inhalation products and expanded manufacturing capacity could provide additional catalysts.
Importantly, expectations are not heroic. Management expects just 2%–4% group revenue growth in 2026 and $720-770M of core operating profit, with analysts expecting profit growth to accelerate again in 2027 and 2028.
For us, Hikma is a compelling example of the broader healthcare opportunity: solid margins, defensive demand, and improving earnings potential in a sector investors have spent years overlooking.
6. In Conversation: Arm Holdings
Earlier this month, we (Aurelion Research) had a really insightful discussion with ARM Holdings’ VP of Investor Relations, Ian Thornton, who has been with the company for more than 20 years. Let’s just say he knows the ARM business pretty well, and we definitely felt it during the conversation.
For context, ARM is one of the largest companies in the UK and one of the most important semiconductor companies globally.
It develops energy-efficient CPU architectures and licenses them to major technology companies around the world.
It was a great call, and we came away with much more than we typically get from larger companies. Bigger companies often stick to the same points they make on earnings calls. For us, these conversations are about getting a better sense of growth drivers, what customers and investors are saying, as well as how competitors are moving.
First, the long-term margin opportunity is much more interesting than we initially thought.
Financial Targets & A Very Different Margin Model
The IP business could become very attractive, with management targeting around a “99% gross profit margin” and potentially 60-65% operating margins.
Those numbers may sound aggressive at first, but ARM has a very different cost structure from most semiconductor companies. The reason is that “everything that goes into that chip is IP that we also license and sell.”
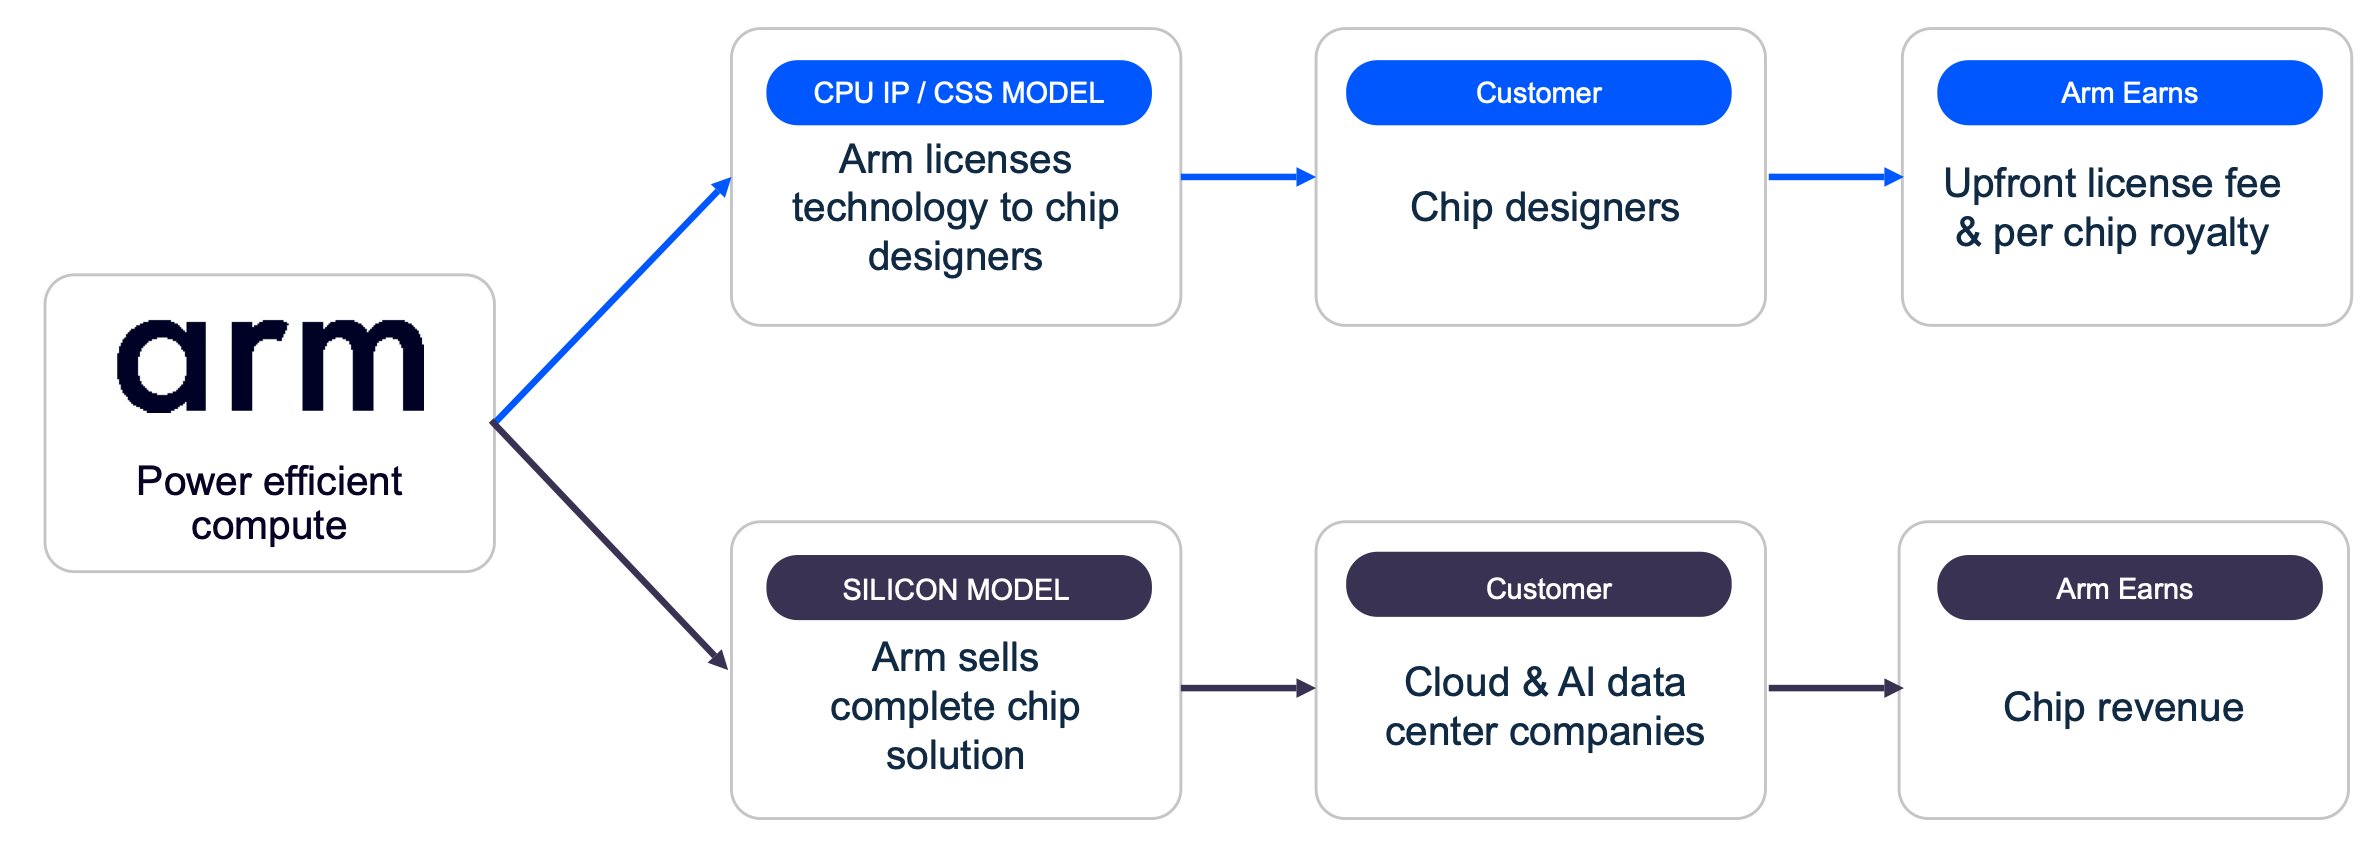
As management put it, “chip costs are just assembly... basically assembly costs.”
That makes the gap between gross and operating margins “a lot, lot tighter than most other semiconductor companies.” Longer term, reaching operating margins around 60% would require moving further toward customer-owned tooling, where “you own the tools that live at the test equipment factory.”
The point here is that ARM is leveraging its existing IP advantage to move further up the value chain while maintaining a relatively asset-light model.
Bringing More of the Chip Development In-House
ARM is also gradually bringing more of the chip development process in-house.
For the first chip iteration, ARM used SocioNext for the back-end processes. For the second, it moved toward a direct relationship with TSMC.
The company also recently completed its acquisition of DreamBig, giving ARM greater capabilities in high-speed interfaces. Previously, it relied on third-party tools from companies such as Synopsys.
The strategy is simple: bring more of the development stack in-house, have greater control over the product, and capture more of the economics.
This also addresses a broader issue ARM encountered when it first started approaching hyperscalers. According to management, the response was essentially: “We don’t want to design chips. We are software and service companies. Don’t make us become silicon designers.”
That is important because ARM is not necessarily asking customers to become chip designers. It can provide much more of the finished solution itself.
And there is a meaningful economic opportunity here.
Management pointed out that if “90% of the IP that goes into that chip is ours,” there is a question of why ARM should let someone else capture a 30% cut for assembling what is largely its own architecture into a finished product.
Enterprise Could Be a Much Bigger Opportunity
One of the more interesting parts of the conversation was around enterprise demand. Companies don’t want to design its own chips. Instead, the question they were asking was essentially: “Why is there no one to sell me this chip?”
That is where ARM saw an opportunity. If “90% of the IP that goes into that chip is ours,” there is “very little opportunity” for competitors to differentiate.
That creates a pretty unique position for ARM. Customers get a chip tailored to their needs, while ARM can capture a significant portion of the economics because it already owns most of the underlying IP.
We think this could become an increasingly important part of the story.
The hyperscalers have already shown that custom silicon can make sense, but there is a much larger group of enterprise customers that simply does not have the resources or desire to build an internal chip team.
Competitive Moat & Future Workloads
When it comes to competition, management was pretty direct:
“The only boulders on the runway are Intel and AMD with their x86 chips.”
ARM’s core advantage remains performance per watt. As they put it, “the primary performance metric customers care about today is performance per watt.”
That becomes increasingly important as AI infrastructure puts more pressure on power availability. The computing industry can keep adding GPUs, but eventually you run into a simple problem: there is only so much power available.
This is also where agentic AI becomes particularly interesting.
Management believes “the rise of agentic workloads” could be an important opportunity because “the agentic is pretty much 100% a CPU task.”
GPUs handle the heavy matrix computation, but the orchestration, API calls and sequential logic around those workloads are largely CPU-driven. If agentic workloads become a meaningful part of future computing demand, ARM could benefit from another structural shift toward more efficient CPU architectures.
Robotics & Physical AI
The other area we found particularly interesting was robotics and physical AI.
These applications require much more than raw computing power. They need “redundancy, safety islands, parallel processing.” As management explained, you need “safety critical systems to go into robotics and cars” because a computing failure in these environments can have very serious consequences.

That plays directly into ARM’s strengths. As more computing moves into environments where power efficiency, reliability and safety are just as important as raw performance, ARM’s architecture should become increasingly relevant.
Overall, the biggest takeaway for us was how broad ARM’s opportunity could become. AI infrastructure is only one part of the story. The company is gaining exposure to data centers, enterprise computing, agentic AI, robotics and physical AI, all of which are pushing demand toward more efficient computing. After this conversation, we came away with a much clearer view of why management is so confident in ARM’s long-term growth potential.
7. UK Equities: Pool of Ideas
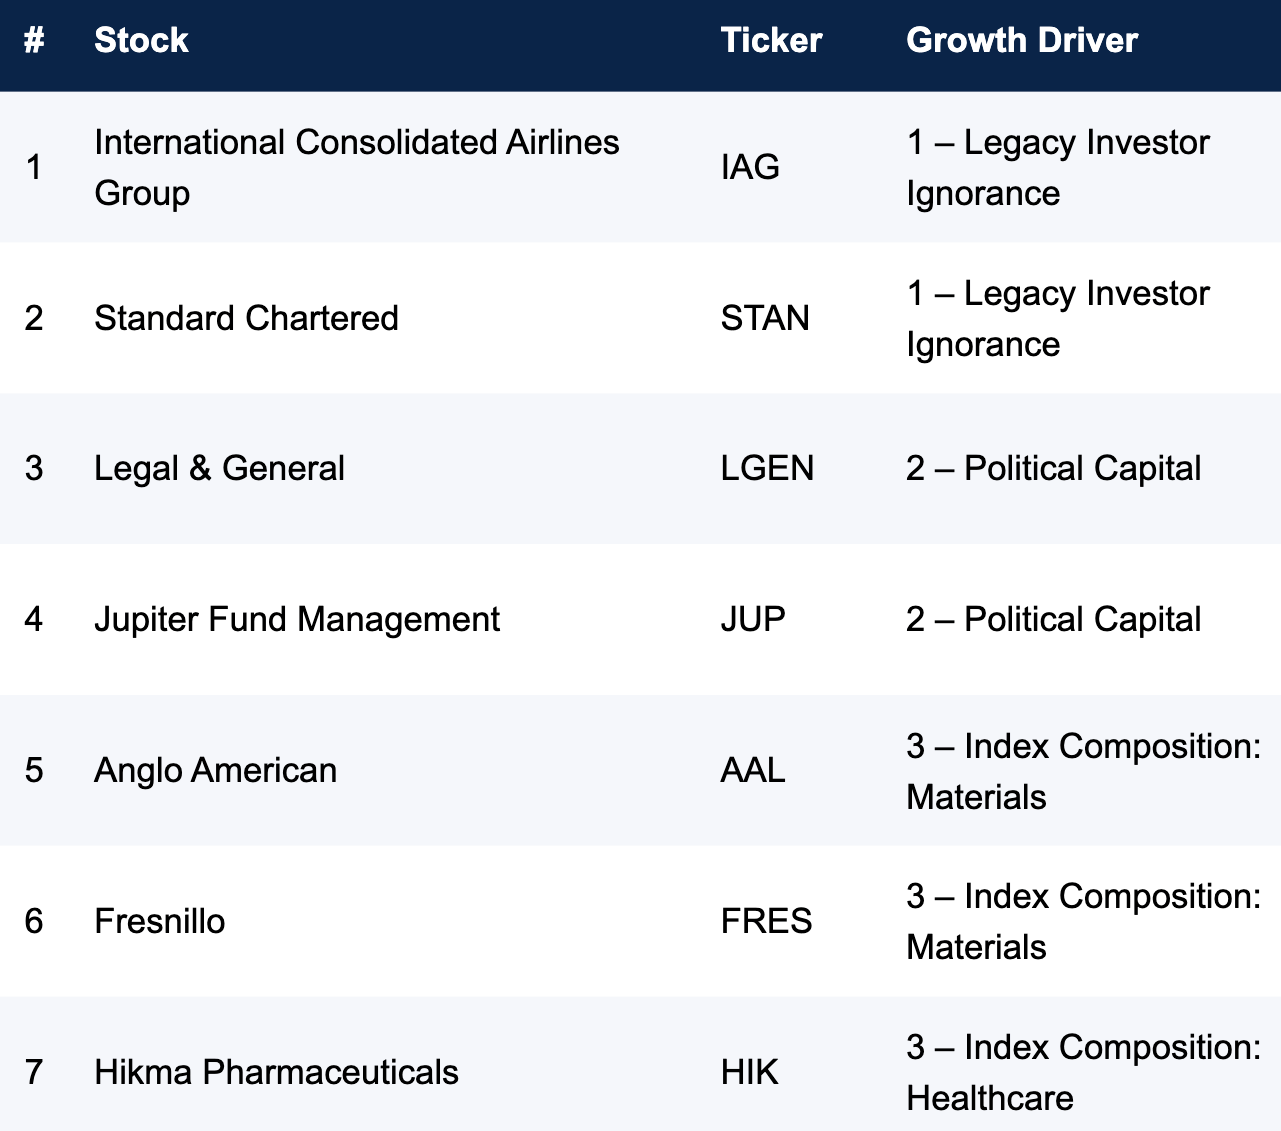
We built a Pool of UK Ideas classified by the three growth drivers we identified earlier, with exposure to financials, healthcare, commodities, and other areas where we see the strongest potential for a re-rating.
ARM Holdings (ARM)
Another company we find interesting is ARM, which we discussed earlier in the piece. We think the company has a lot of room to grow in the semiconductor industry, supported by its strong competitive moat and exposure to the next generation of computing workloads. The main risks, however, are its still very high valuation and questions around whether it can maintain its moat over time.
8. Key Risks
The simplest way to explain the main risk from our primer is that UK equities are not necessarily expensive, but the catalysts needed to unlock their value may fail to materialize.
1. The Valuation Gap Could Persist
The UK discount, particularly in equities, could prove to be more fundamental than we expect. Although we believe it is cyclical and already starting to change, our thesis assumes that the valuation gap continues to close as international investors rediscover the market. Cheap, however, does not automatically mean mispriced, and investors could continue to look elsewhere for years.
2. Reforms Could Disappoint
Another risk is that Burnham fails to turn political momentum into meaningful economic reform. The early days of any government are not always a good indicator of future investment performance. A key part of our thesis is that greater political stability and policies aimed at mobilising British savings can improve domestic investment. The risk is that implementation disappoints, reforms are watered down, or political opposition prevents meaningful change.
3. Fiscal Risk
Finally, there is fiscal credibility, an area where the UK has struggled in recent years. Burnham has so far avoided a major fiscal-risk event, but the October Budget will be an important test.
Higher borrowing, unfunded spending commitments, or overly optimistic growth assumptions could push gilt yields higher and put pressure on sterling and UK equity valuations. The 2022 experience under PM Truss showed how quickly UK assets can reprice when confidence in fiscal policy is lost.
9. Concluding Thoughts
Here we fly the flag for the UK.
Expectations remain relatively low, valuations remain attractive, and for the first time in a while there are identifiable catalysts capable of changing the narrative.
Importantly, our bullish case doesn’t require Britain suddenly to become the world’s fastest-growing economy. That’s just not realistic. Rather, we need the direction of travel to improve. The signs are there that this can be the case, from credible fiscal policy and a modest redirection of Britain’s enormous savings pool.
Massive 🇬🇧
Really enjoyed this article and I learned a bit about new PM Burnham who I don’t know much about. I like the Standard Chartered pick, it’s a really great company and has a large presence in emerging/frontier markets specifically Africa. Investors are starting to realize that the UK is still a safe place to bet on, and it’s now offering attractive discounts while Gilts offer attractive yields. In a time where previously “safe” havens are seen as more risky, I agree UK is low risk and higher reward than ever.