
Global Fertilizer Primer 2026: Uncovering the Real Threat to Global Farming
We believe behind the daily headlines of shipping disruptions lies a fundamental threat to the agricultural supply chain that has yet to be fully priced in.

Our previous Chemicals Primer was by far the most popular report we have published on this platform. Our team also holds strong opinions and has heavily researched the fertilizer sector to produce what we believe is the most comprehensive report on the space.
Let’s get into it. The fascinating universe of fertilizers. So, what are they and why are they so important? Well, first, the war in the Middle East has created major disruptions to global supplies of nitrogen-based crop nutrients.
The focus since the conflict began has been on urea, a key nitrogen fertilizer used on corn. Prices for the nutrient have surged as the war blocks shipments through the Strait of Hormuz, sending farmers scrambling to secure supplies.
But we think the risk to phosphate fertilizers has been largely overlooked. They are essential for crops like soybeans and a big part of global food production. The region may not dominate phosphate trade directly, but it still plays a critical role upstream.
A large share of global sulphur supply, a key input used to process phosphate rock, comes from countries exposed to the same disruptions. That is where the risk builds. As inventories get worked down, pressure moves through the supply chain and tightens availability broadly. And since phosphate is used across a wide range of crops, the impact goes well beyond a single market.
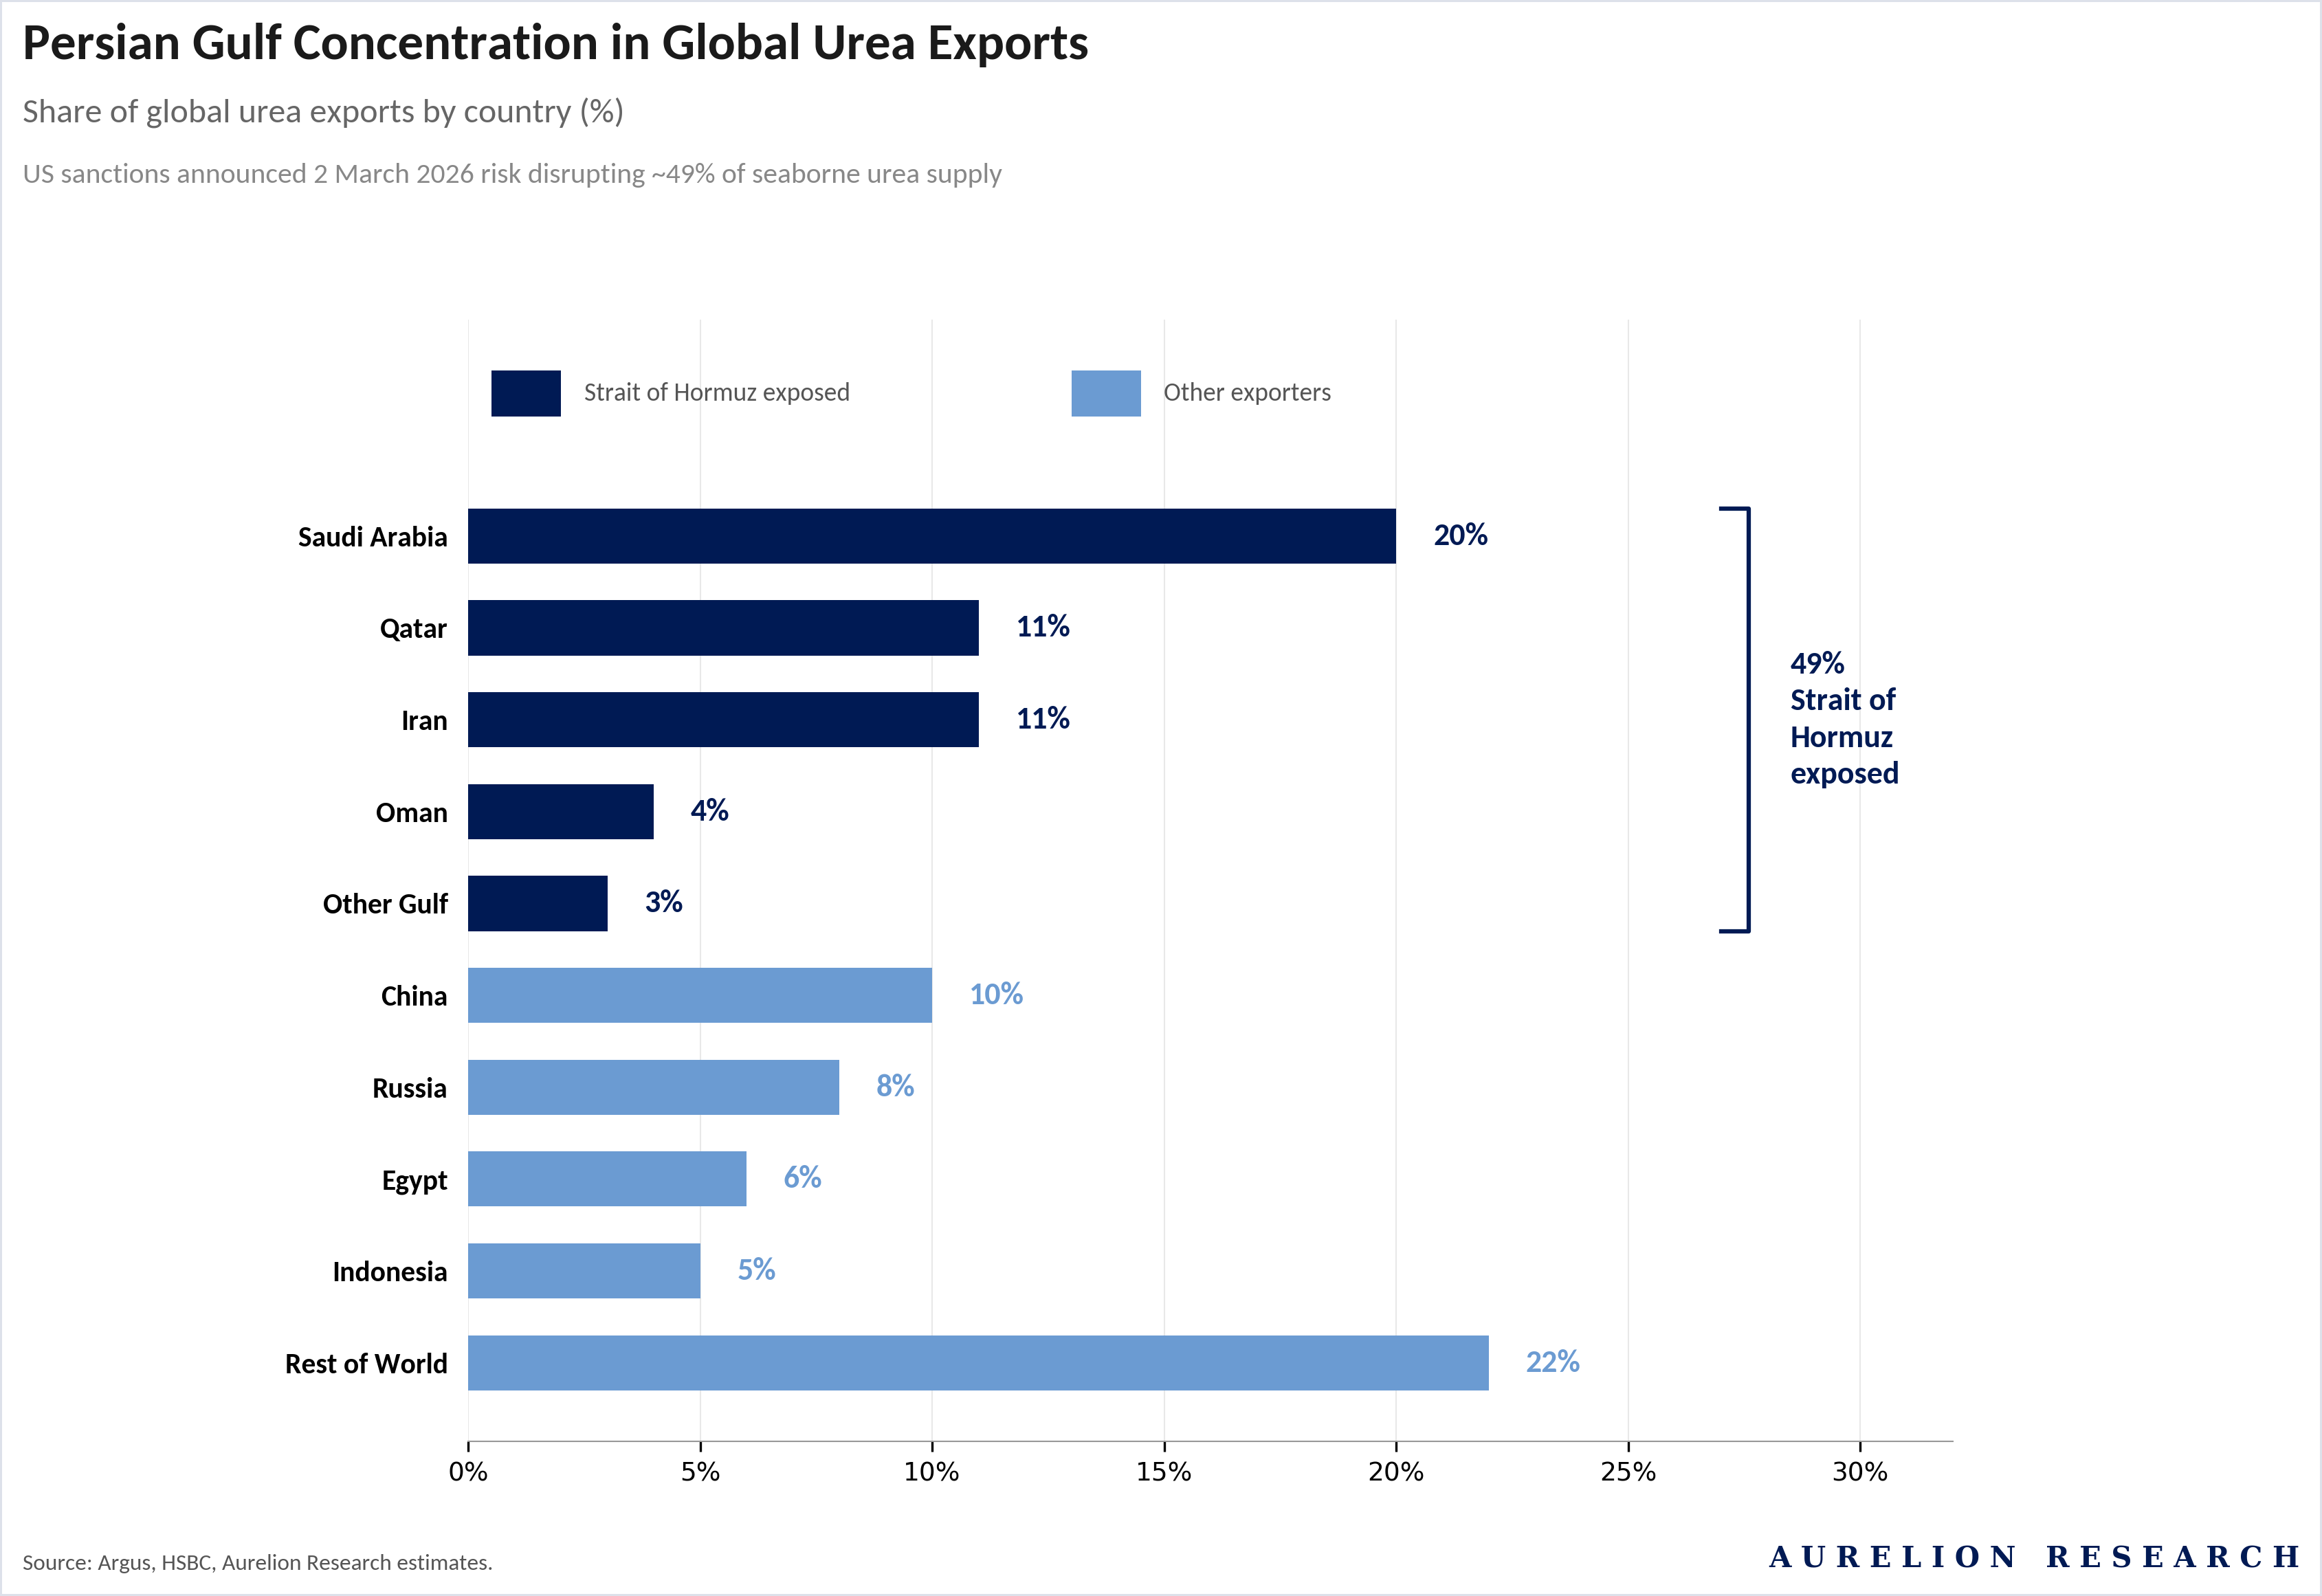
The Persian Gulf concentration makes this tangible. Nearly 45% of global urea trade is sourced from producers on the Gulf coast and shipped via the Strait of Hormuz. In total, 49% of global seaborne urea exports are Hormuz-exposed, with Saudi Arabia (20%), Qatar (11%), Iran (11%), Oman (4%) and other Gulf producers (3%) accounting for roughly half of global supply.
US sanctions announced on 2 March 2026 risk disrupting this entire corridor, with potential to impact both the nitrogen and phosphate fertilizer segments.
The disruption is already visible in prices and physical flows.
US Gulf granular urea has surged past $800/t, a level last seen during the 2022 spike. According to Argus, urea prices jumped nearly 50% from late February to mid-March, with ammonia up around 24% over the same period.
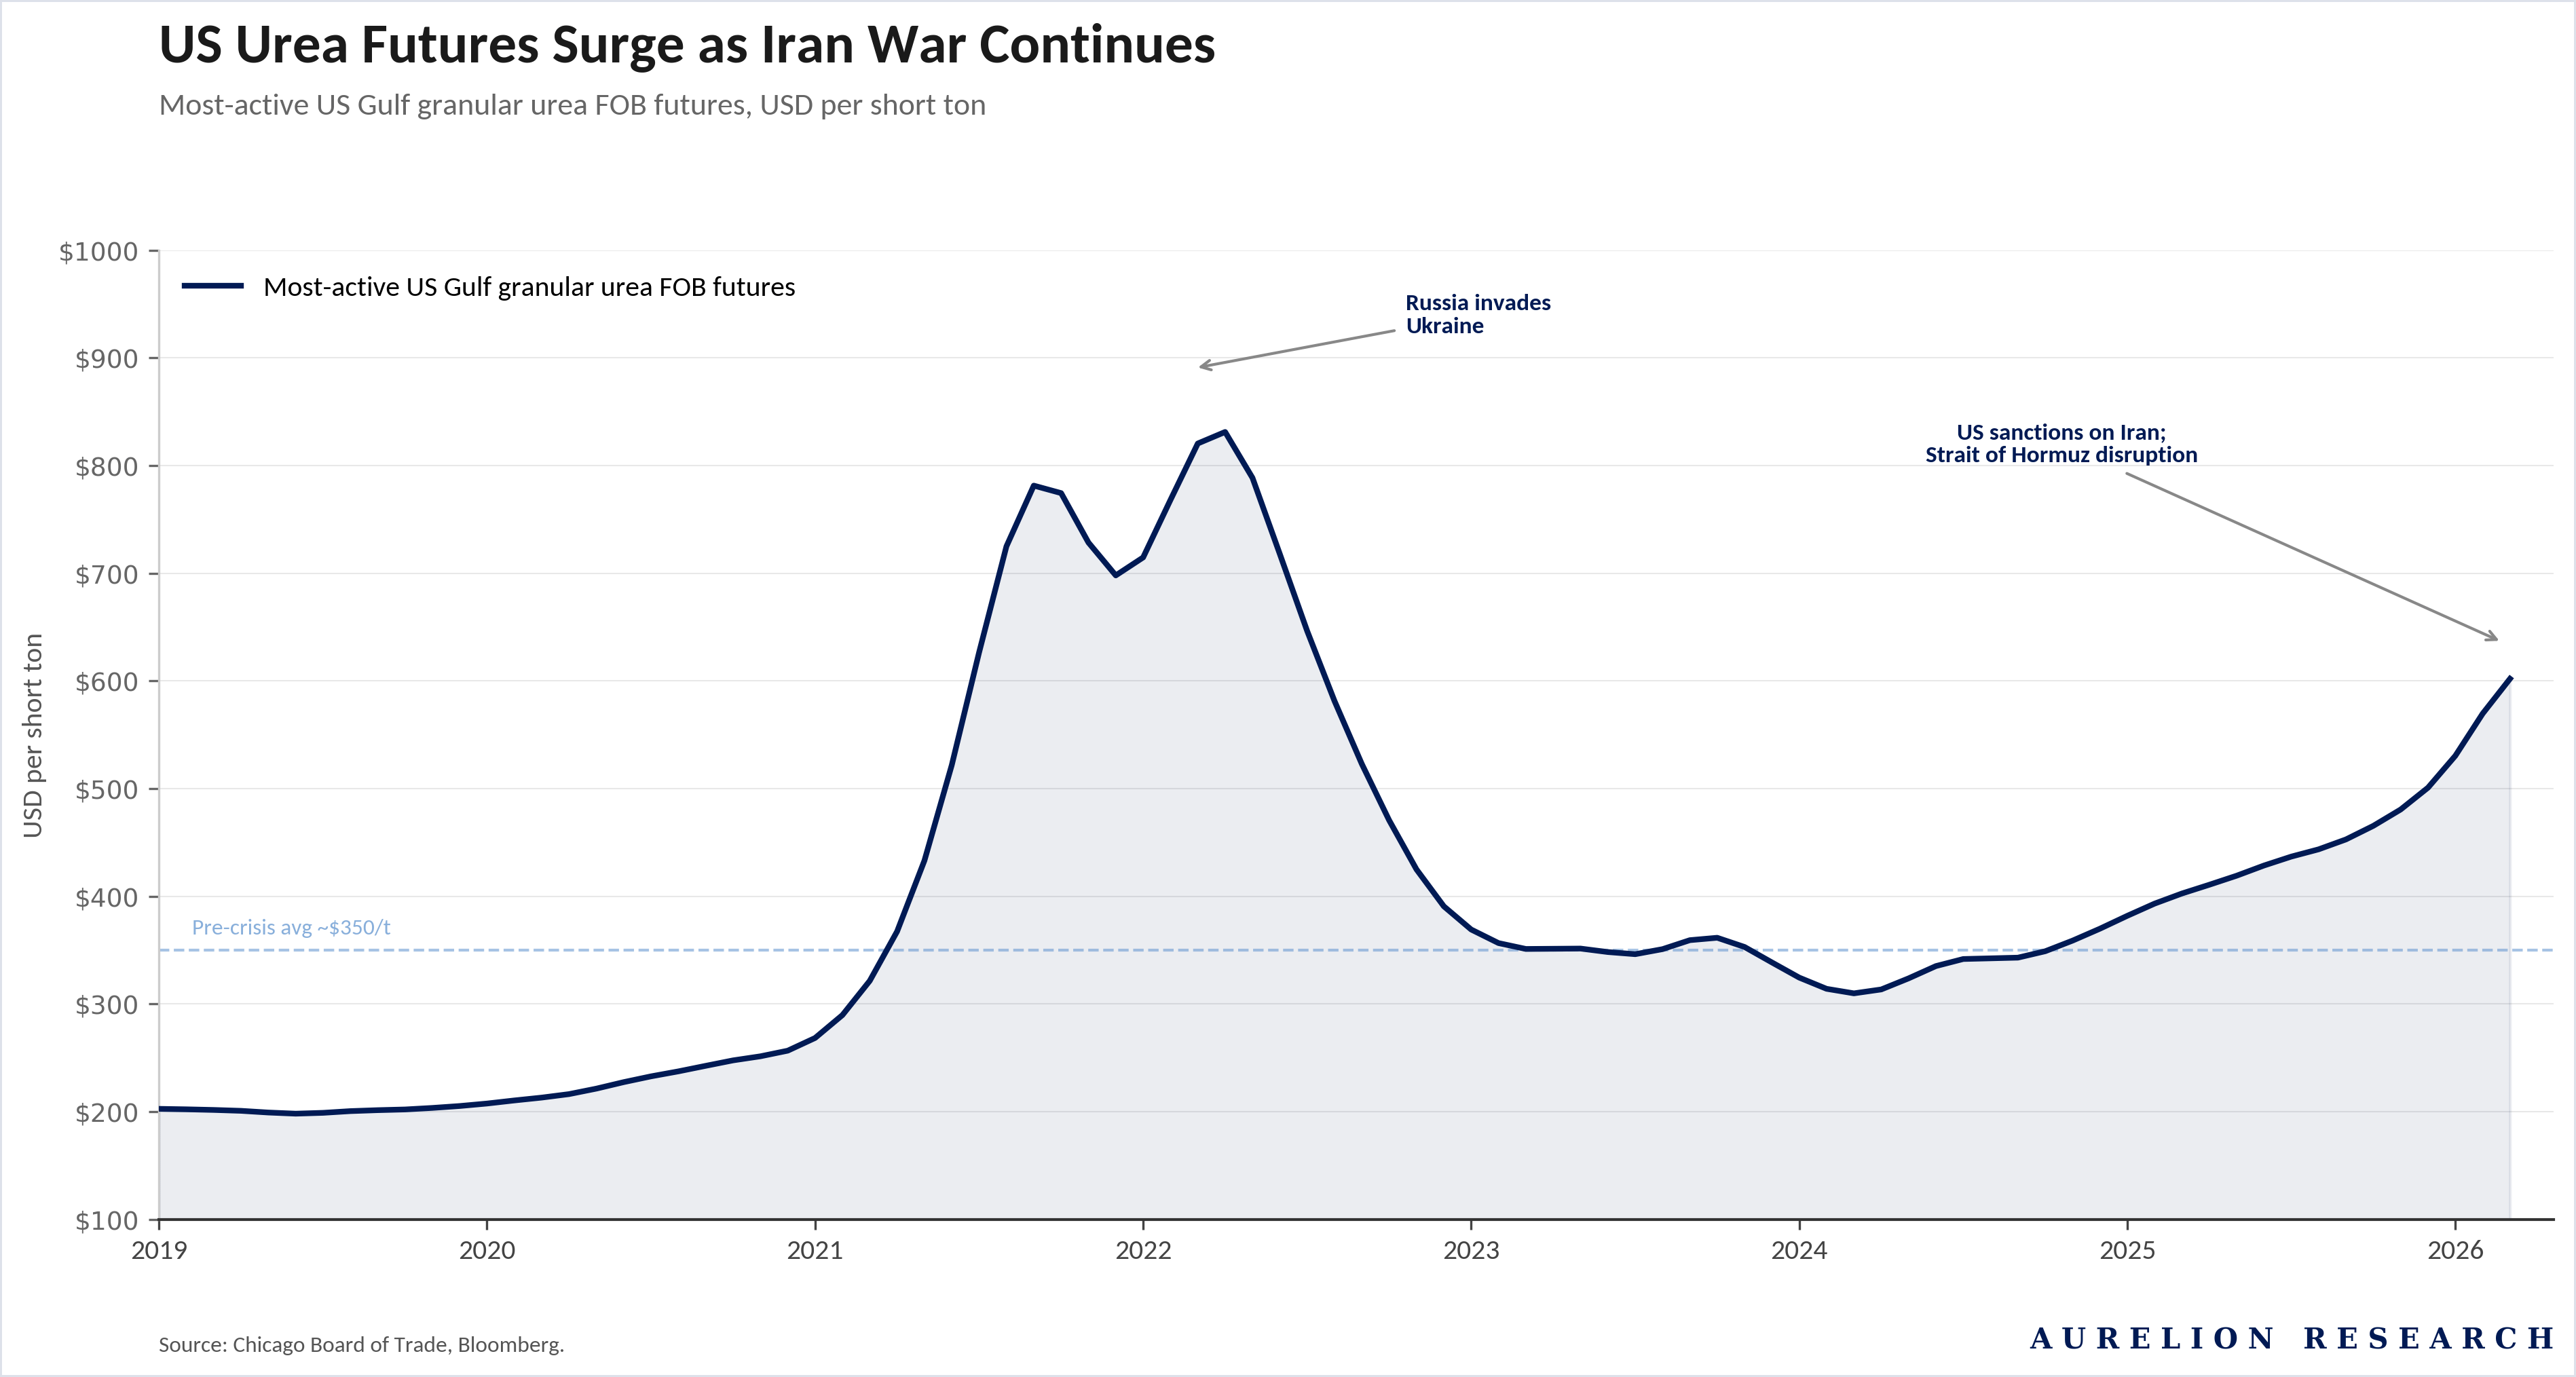
Table of Contents
Introduction
What are Fertilizers?
Fertilizer Industry Overview
2.1 Potash Outlook
2.2 Nitrogen Outlook
2.3 Phosphate Outlook
Who Are the Big Players?
3.1 Nutrien
3.2 Mosaic Company
3.3 Yara
Our Favorite Ideas
Fertilizer Demand Drivers
Fertilizer Supply Drivers
Urea Outlook
What About China?
What About Russia?
The Threat to Global Farming
Our Final Take on the Fertilizer Market
0. Introduction
The risks extend well beyond shipping. As discussed by HSBC’s Sriharsha Pappu, upstream shut-ins of energy production, given limited storage and lack of export alternatives, have already been observed in Iraq and Kuwait.
These disruptions have the potential to force shutdowns of downstream chemical and fertilizer capacity due to feedstock shortages, as already seen in Qatar. Restarting idled capacity could take months, and given the relatively inelastic demand profile of fertilizers, even a temporary supply shock carries the risk of keeping prices elevated for an extended period.
The knock-on effects are cascading globally. India has directed that domestic natural gas supply to the fertilizer sector be capped at ~70-75% of typical needs, resulting in an estimated production loss of ~800,000 tonnes per month of urea. China, which normally fills supply gaps during its off-season, is unlikely to export nitrogen or phosphate fertilizers in the near term, as it grapples with its own sulphur and energy supply constraints.
Around half of China’s 9.6M tonnes of sulphur imports in 2025 came from Middle East. The downstream consequences are significant for major agricultural importers. Australia sourced over 60% of its urea from the Middle East in 2025, with domestic stocks expected to last only until April.
Brazil, entering its 2026-27 soybean purchasing campaign, typically covers 25-30% of its phosphate fertilizer needs from China and roughly half of its urea from the Middle East. Both sources are now constrained. In the US, Trump administration has announced a Jones Act waiver to facilitate domestic deliveries of fertilizer between ports, and is allowing imports from Venezuela.
Why Fertilizer Prices Drive Food Costs?
The chart below shows how closely corn and urea futures have tracked each other over the past six years. The logic is straightforward: nitrogen fertilizer is the single largest input cost for corn, so when urea moves, corn tends to follow. The 2021-22 period is the best example. Gas prices surged in Europe, Russia’s invasion of Ukraine disrupted trade flows, and urea tripled.
Corn followed, moving above 1,000 cents/bu in 2022-23. The two traded together for nearly two years before coming back down through 2024-25.
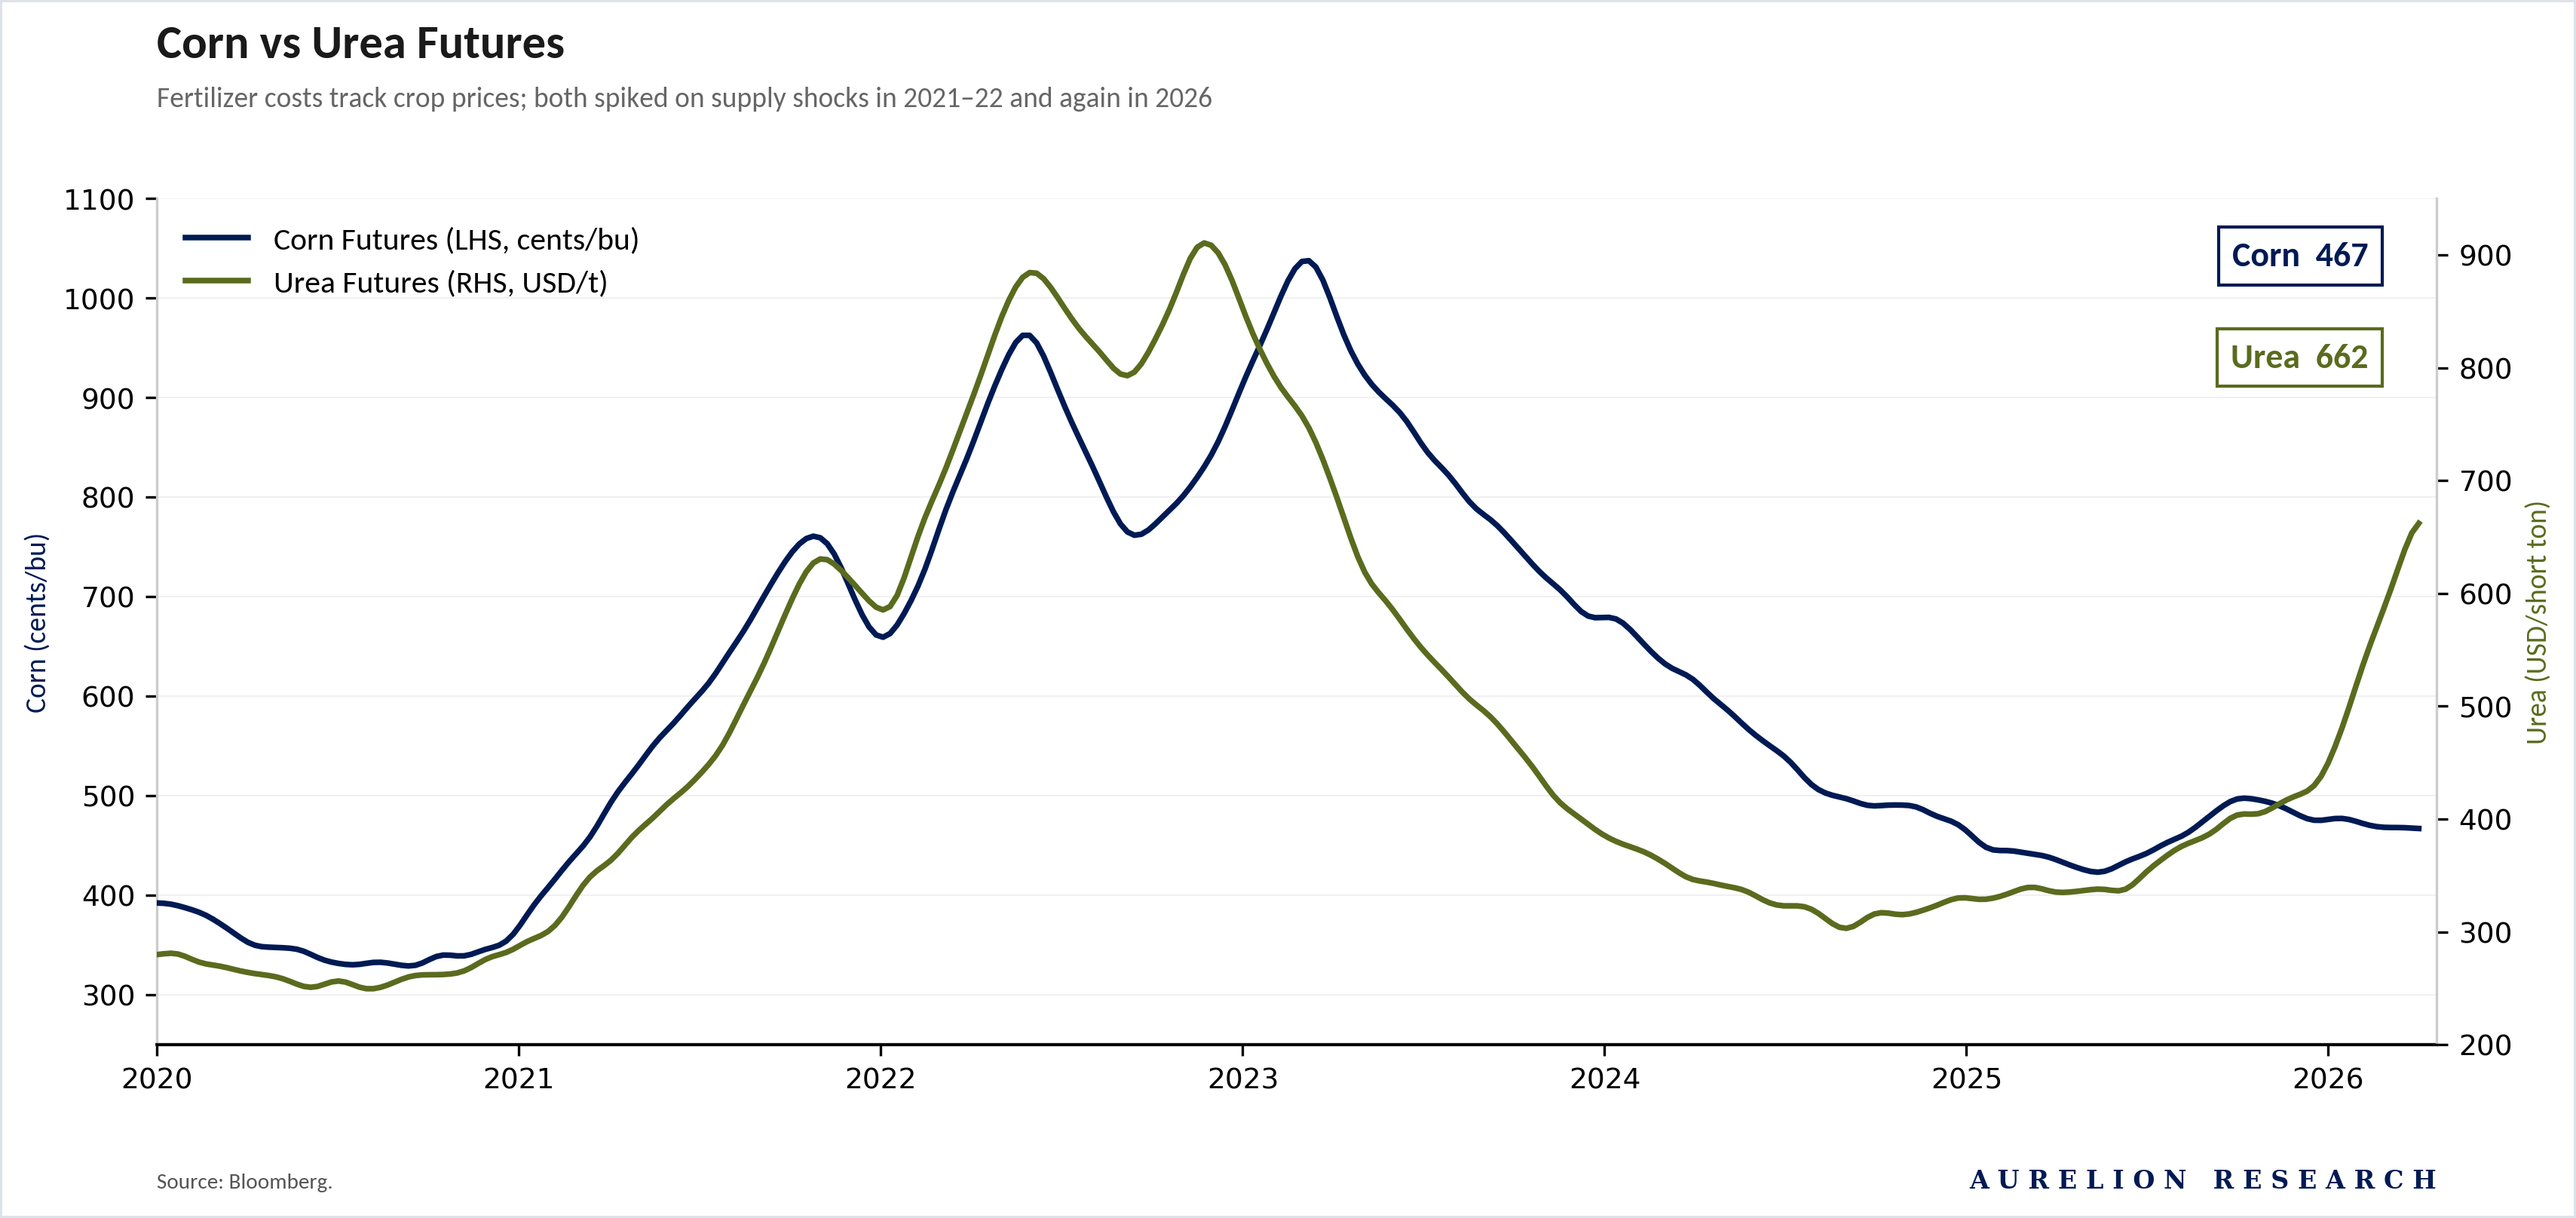
Now looking at the right side of the chart. Urea is spiking again on the back of the Persian Gulf disruption, already at $662/t. Corn, at 467 cents/bu, has started to move up but has not followed with the same force. The gap between the two is widening, and the question is whether it closes.
Two paths from here. If the Hormuz disruption fades and alternative supply from southeast Asia or Venezuela fills the gap, the urea spike unwinds and corn stays in its range. But if the conflict drags on and Chinese exports stay offline, the 2022 pattern is the better guide. Farmers facing higher input costs will either absorb them or plant fewer acres.
We see both outcomes pointing to higher grain prices.
1. What are Fertilizers?
Fertilizers supply the three essential nutrients that crops need to grow:
Potassium (K) = Potash
Nitrogen (N) = Nitrogen
Phosphorus (P) = Phosphate
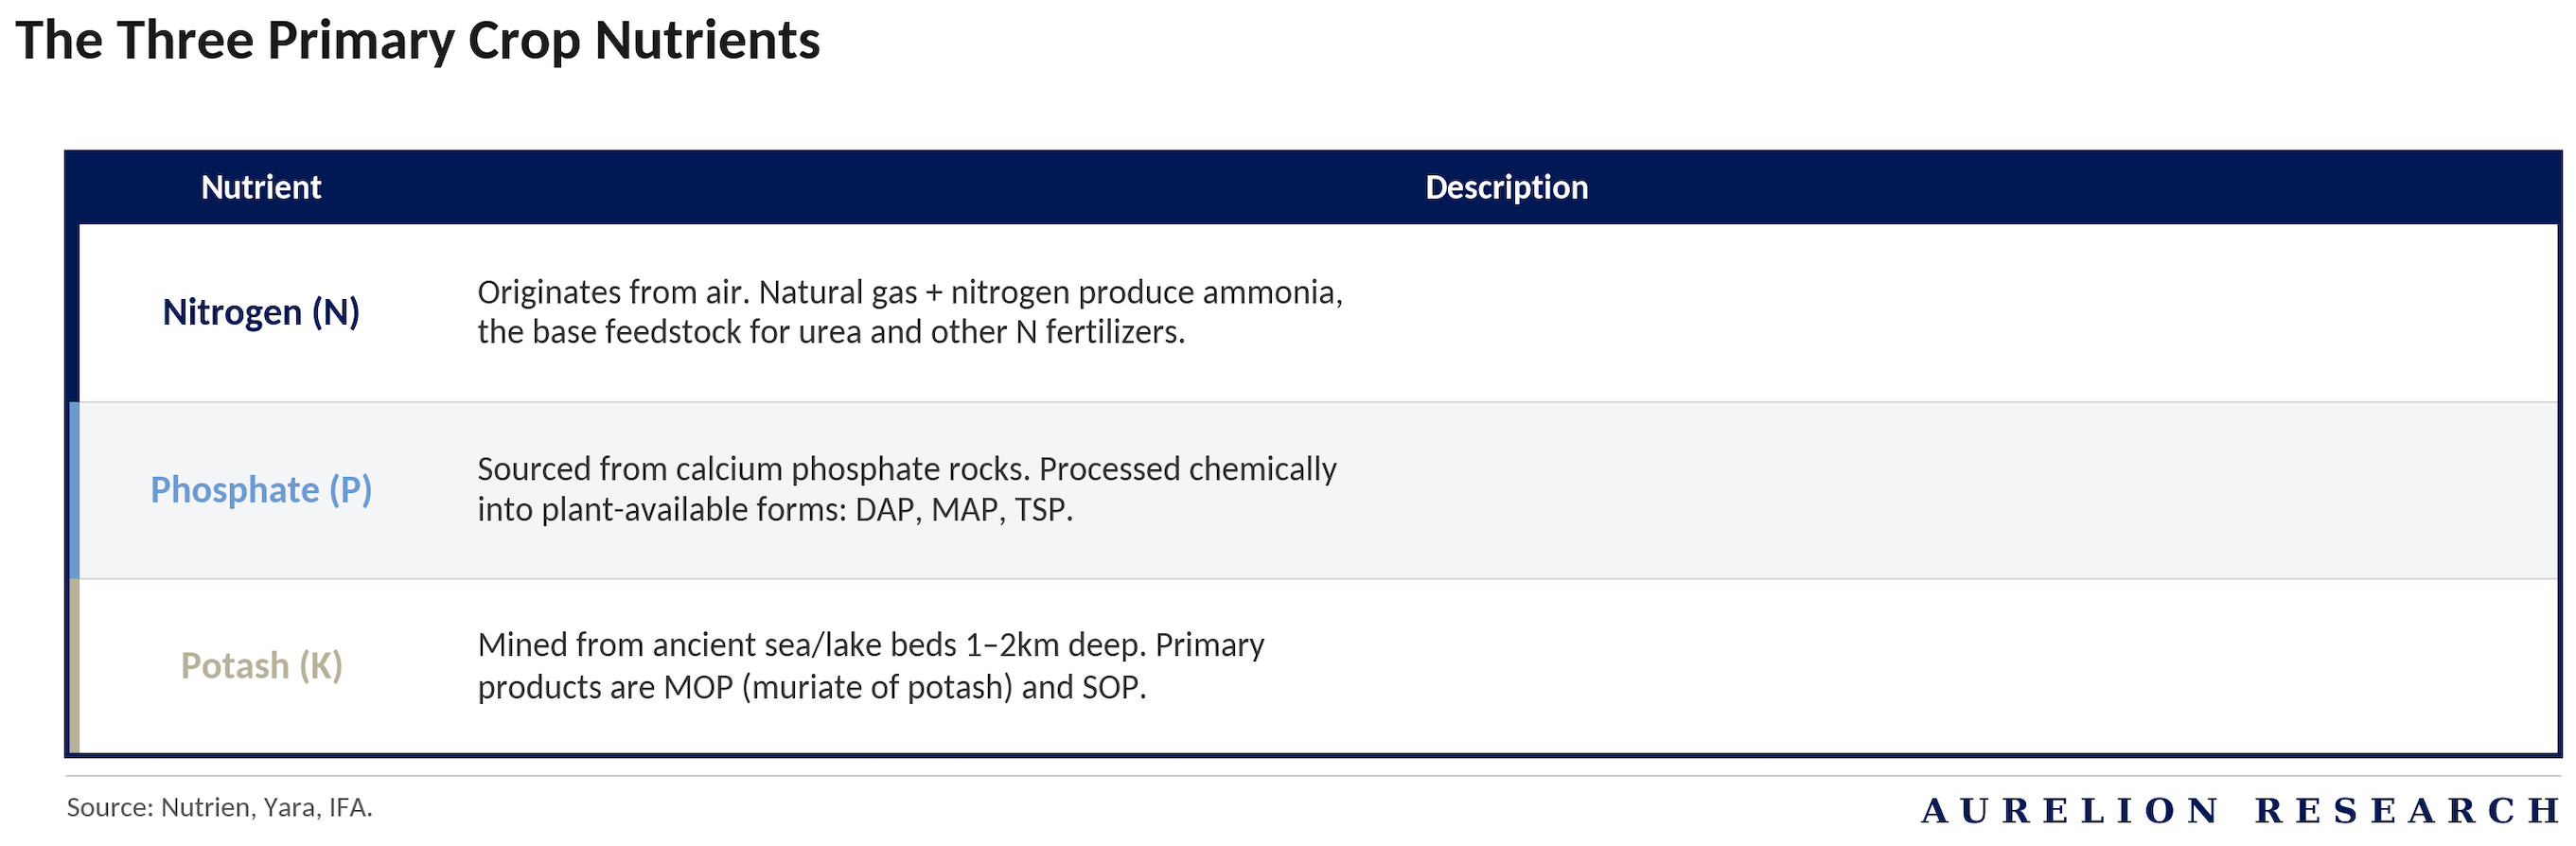
Each plays a distinct biological role, is produced through a different process, and has its own supply chain dynamics.
1. Potash (K)
Potash keeps plants healthy. It strengthens roots, helps retain water and makes crops more resistant to heat and disease. The product is potassium chloride (KCl), which is mined from deep underground deposits or extracted from salt lakes. About 80% of global supply comes from conventional underground mines. It is sold as either granular (preferred in the US and Brazil for blending) or standard grade (more common in Asia).
2. Nitrogen (N)
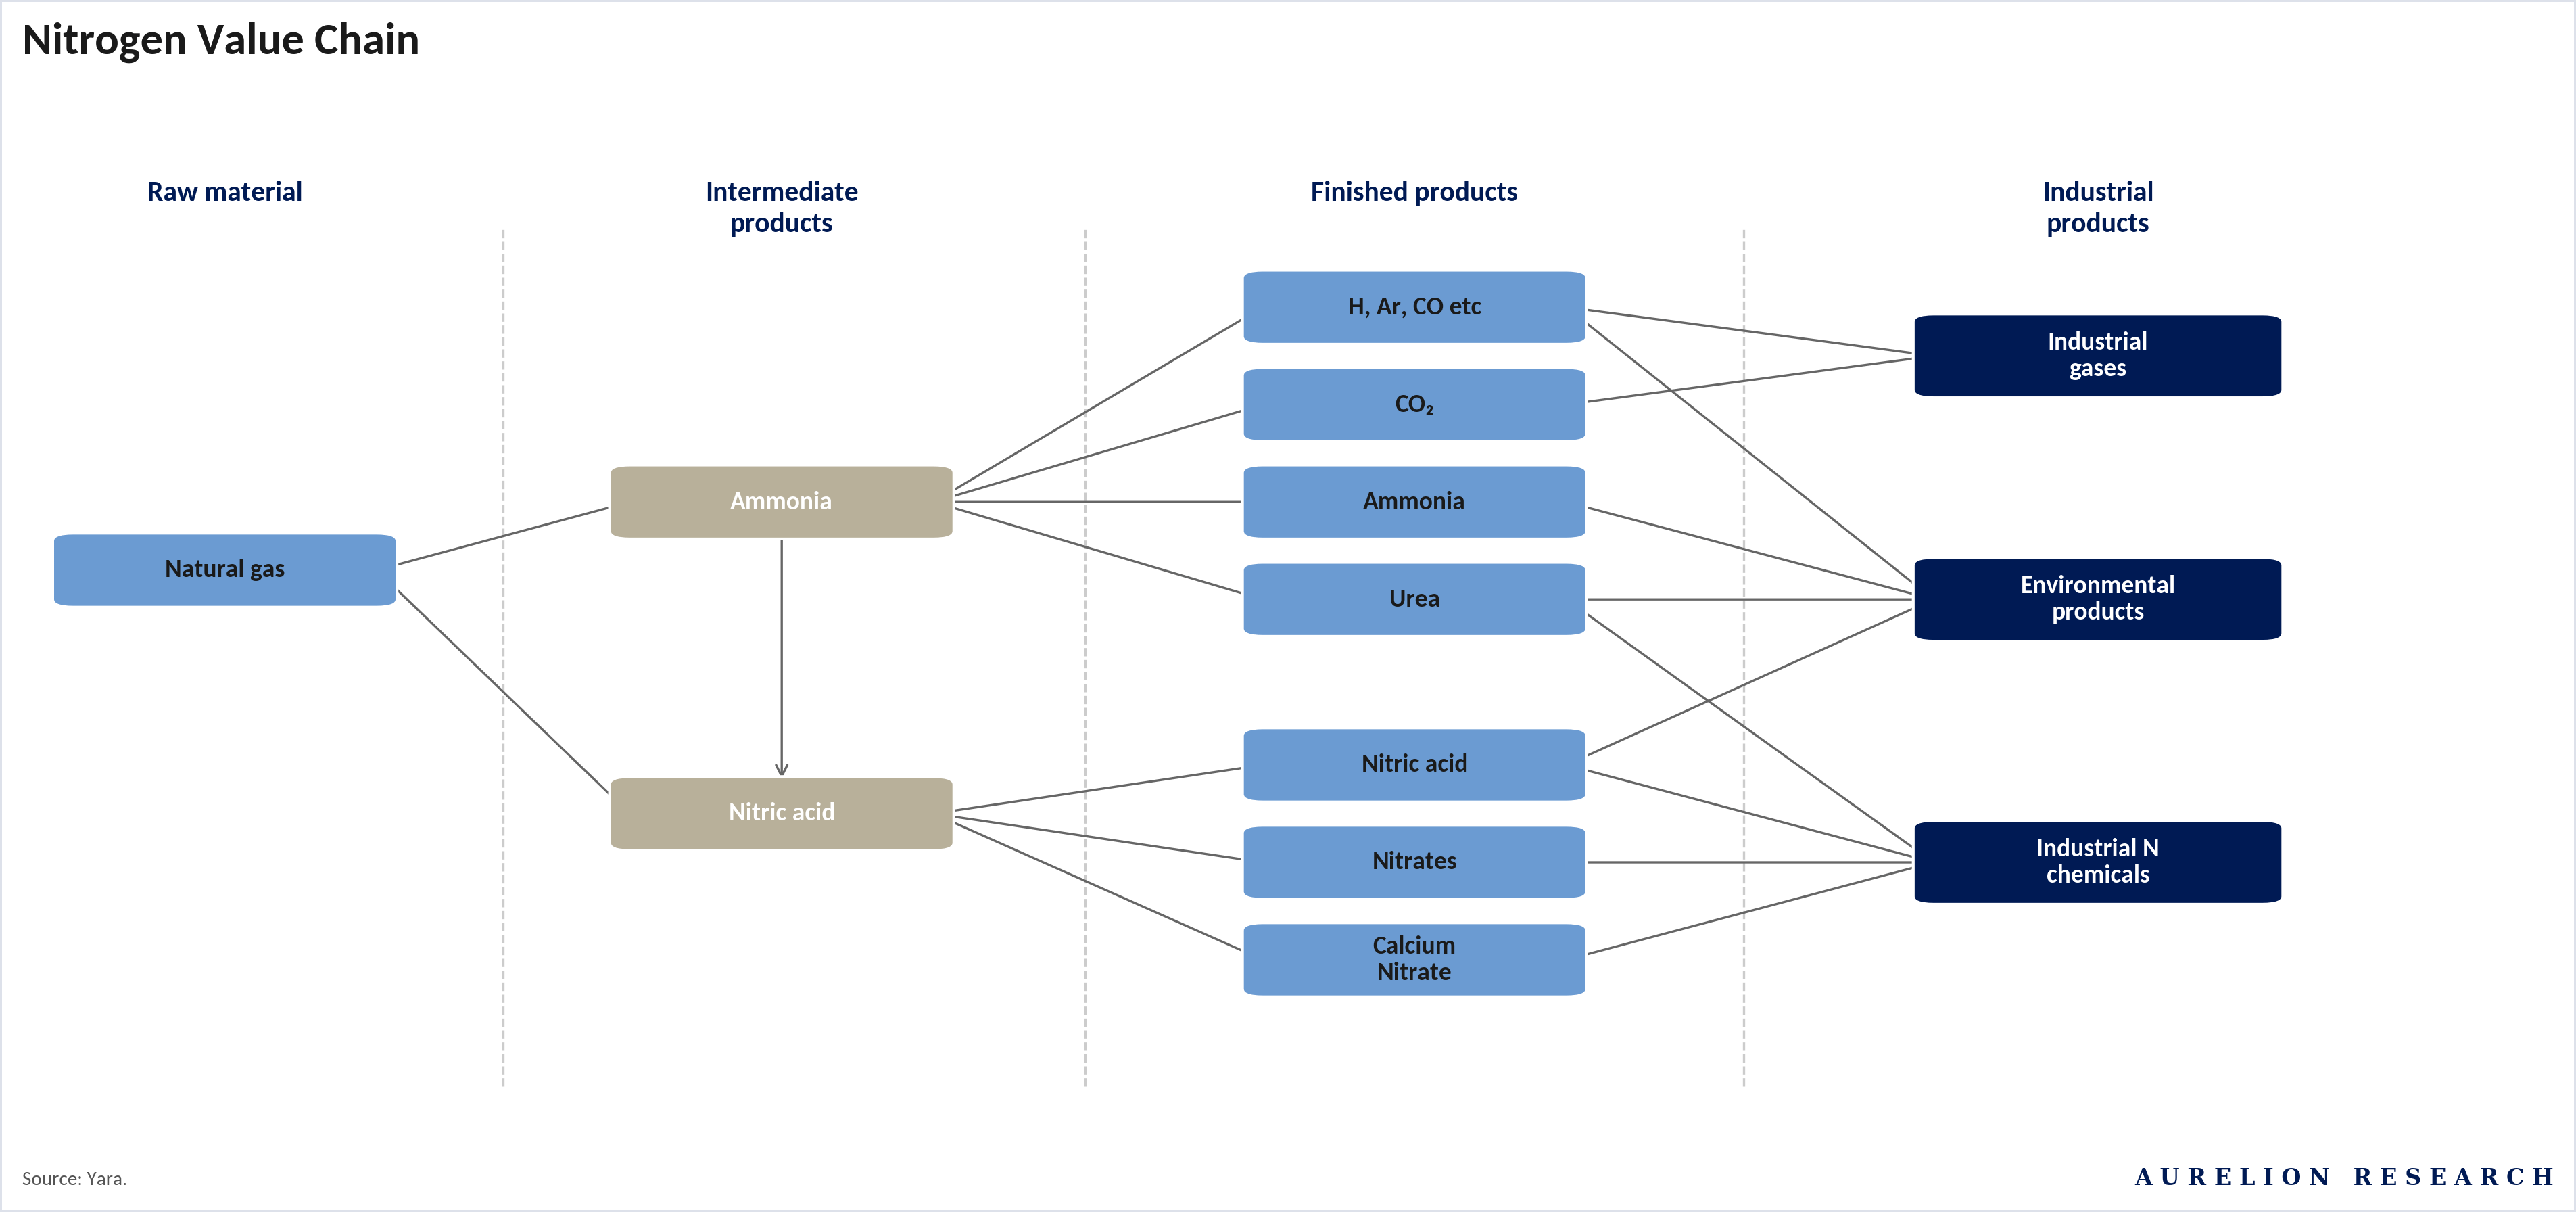
Nitrogen makes plants grow. It is the single most important nutrient for crop yield and is used in the largest volumes globally. Production begins with ammonia, made from natural gas (or coal), steam and air. Ammonia is then converted into urea, the most widely traded nitrogen fertilizer. Urea also has industrial uses in plastics, resins and emissions control. Liquid blends such as UAN are also common in agriculture.
3. Phosphate (P)
Phosphate powers the plant from the inside. It drives photosynthesis, root development and maturation. Phosphate rock is mined, then processed into phosphoric acid, the base ingredient for most fertilizer and feed products. The main end products are MAP and DAP (solid fertilizers) and liquid fertilizer. Beyond agriculture, phosphate is gaining importance as a key input for LFP batteries used in electric vehicles.
Global Fertilizer Market by Product
Nitrogen is by far the largest segment at 109M tonnes of annual consumption, and urea alone accounts for half of it. This is why the Persian Gulf disruption matters so much: the single biggest product in the single biggest nutrient segment is the one most exposed to Strait of Hormuz risk.
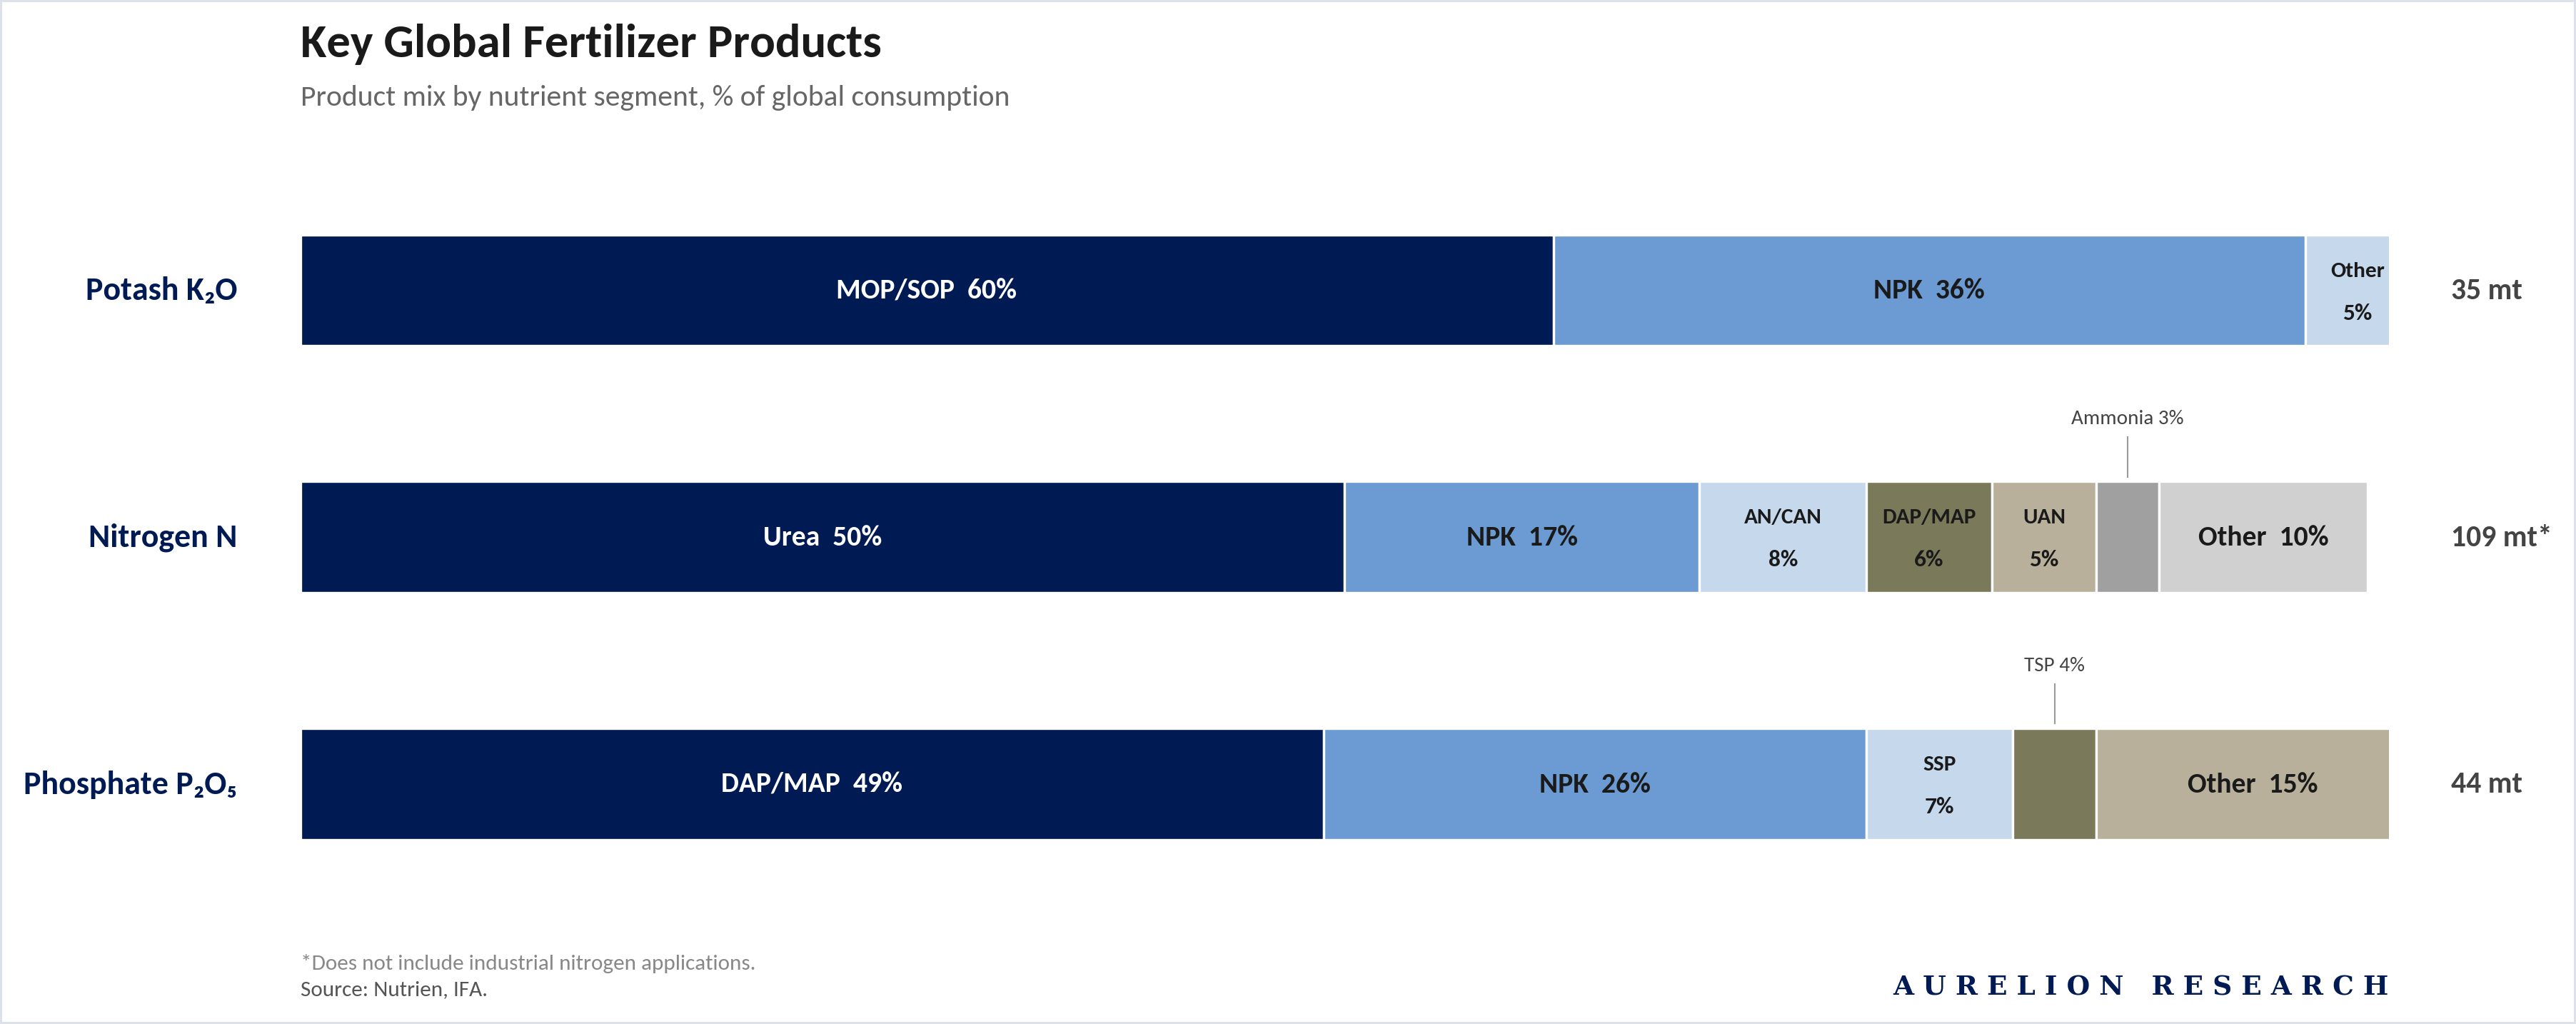
Phosphate comes in at 44M tonnes, dominated by DAP/MAP and NPK blends. This is the segment most affected by Chinese export restrictions and the sulphur squeeze. Potash is the smallest at 35M tonnes and less directly exposed to the current Middle East disruption.
The hidden link across all three segments. NPK blends show up in every nutrient category, accounting for 36% of potash, 17% of nitrogen and 26% of phosphate consumption. They require inputs from all three nutrients to produce, meaning supply constraints in nitrogen and phosphate will ripple into potash-containing products as well. No segment is truly insulated.
2. Fertilizer Industry Overview
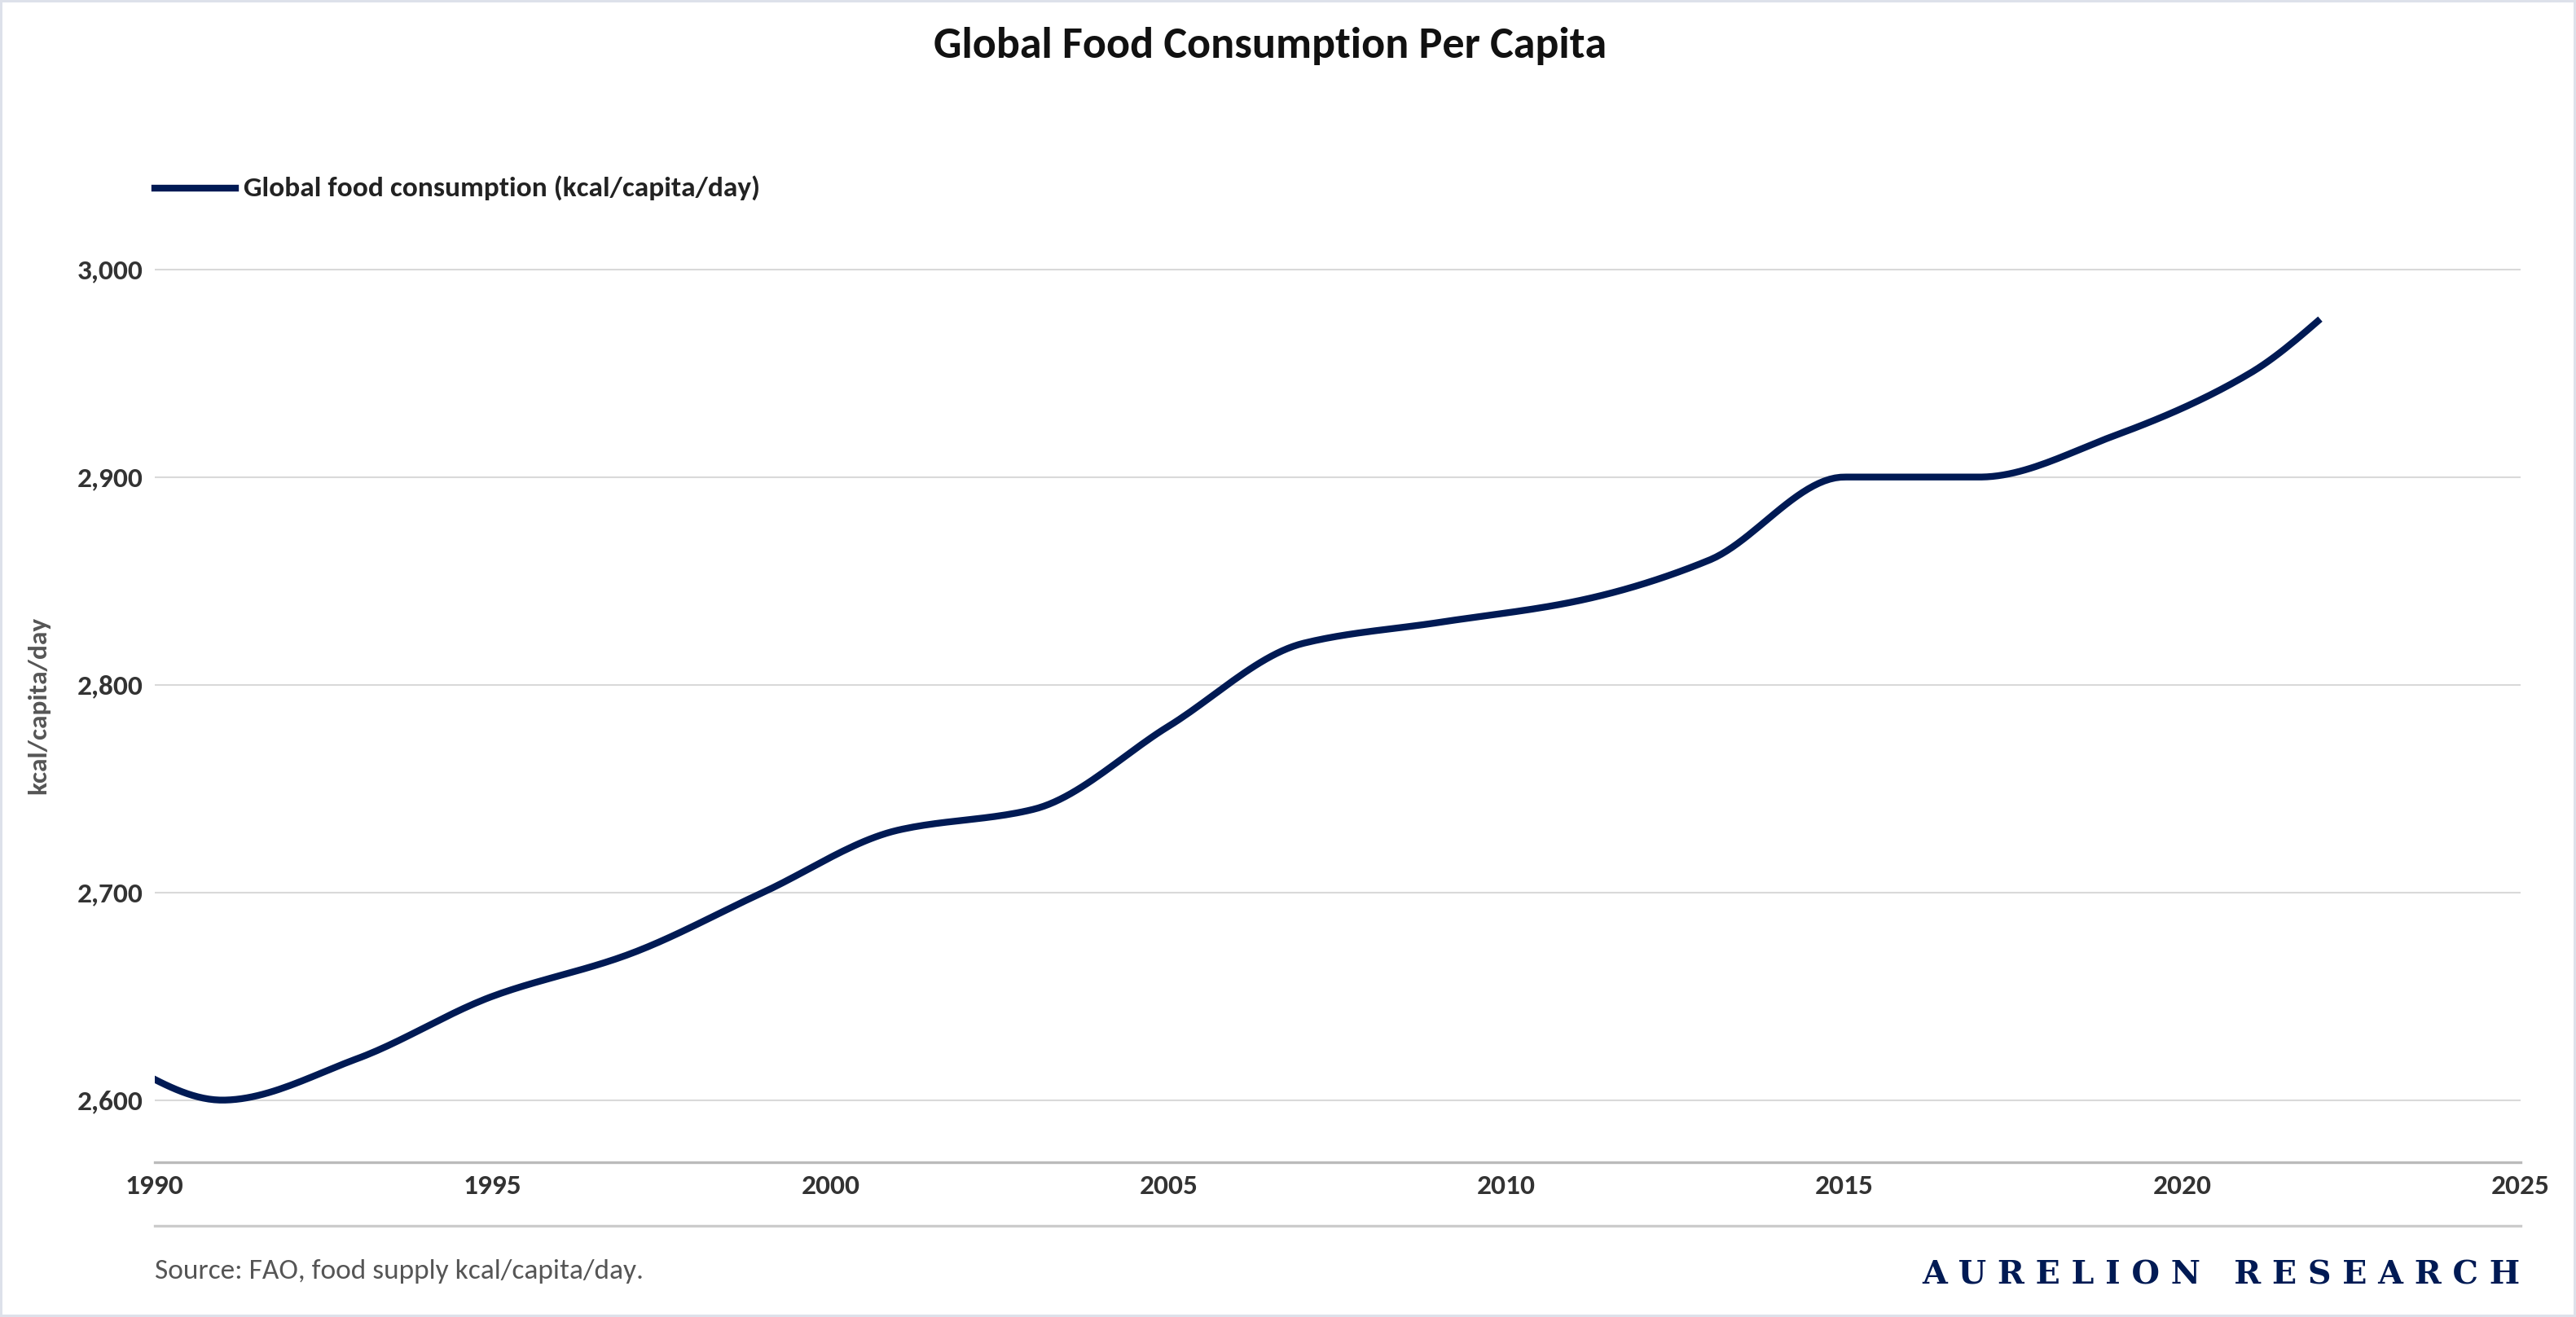
The long term growth narrative for nutrient consumption is driven by two distinct engines. On the agricultural side, baseline population growth is amplified by shifting diets in developing economies, specifically the transition toward protein rich foods and higher fruit and vegetable consumption.
As illustrated in the global consumption data, caloric intake per capita has maintained a steady upward trajectory for over three decades, creating a persistent floor for fertilizer demand.
These macro food security drivers are reinforced by a secondary industrial growth vector. This demand is tied directly to broader economic expansion and tightening environmental regulations, most notably the increasing global mandates for nitrogen oxide emissions (NOx) reductions.
We believe this dual exposure insulates overall consumption from isolated sector shocks and reinforces the case for sustained global capacity utilization.
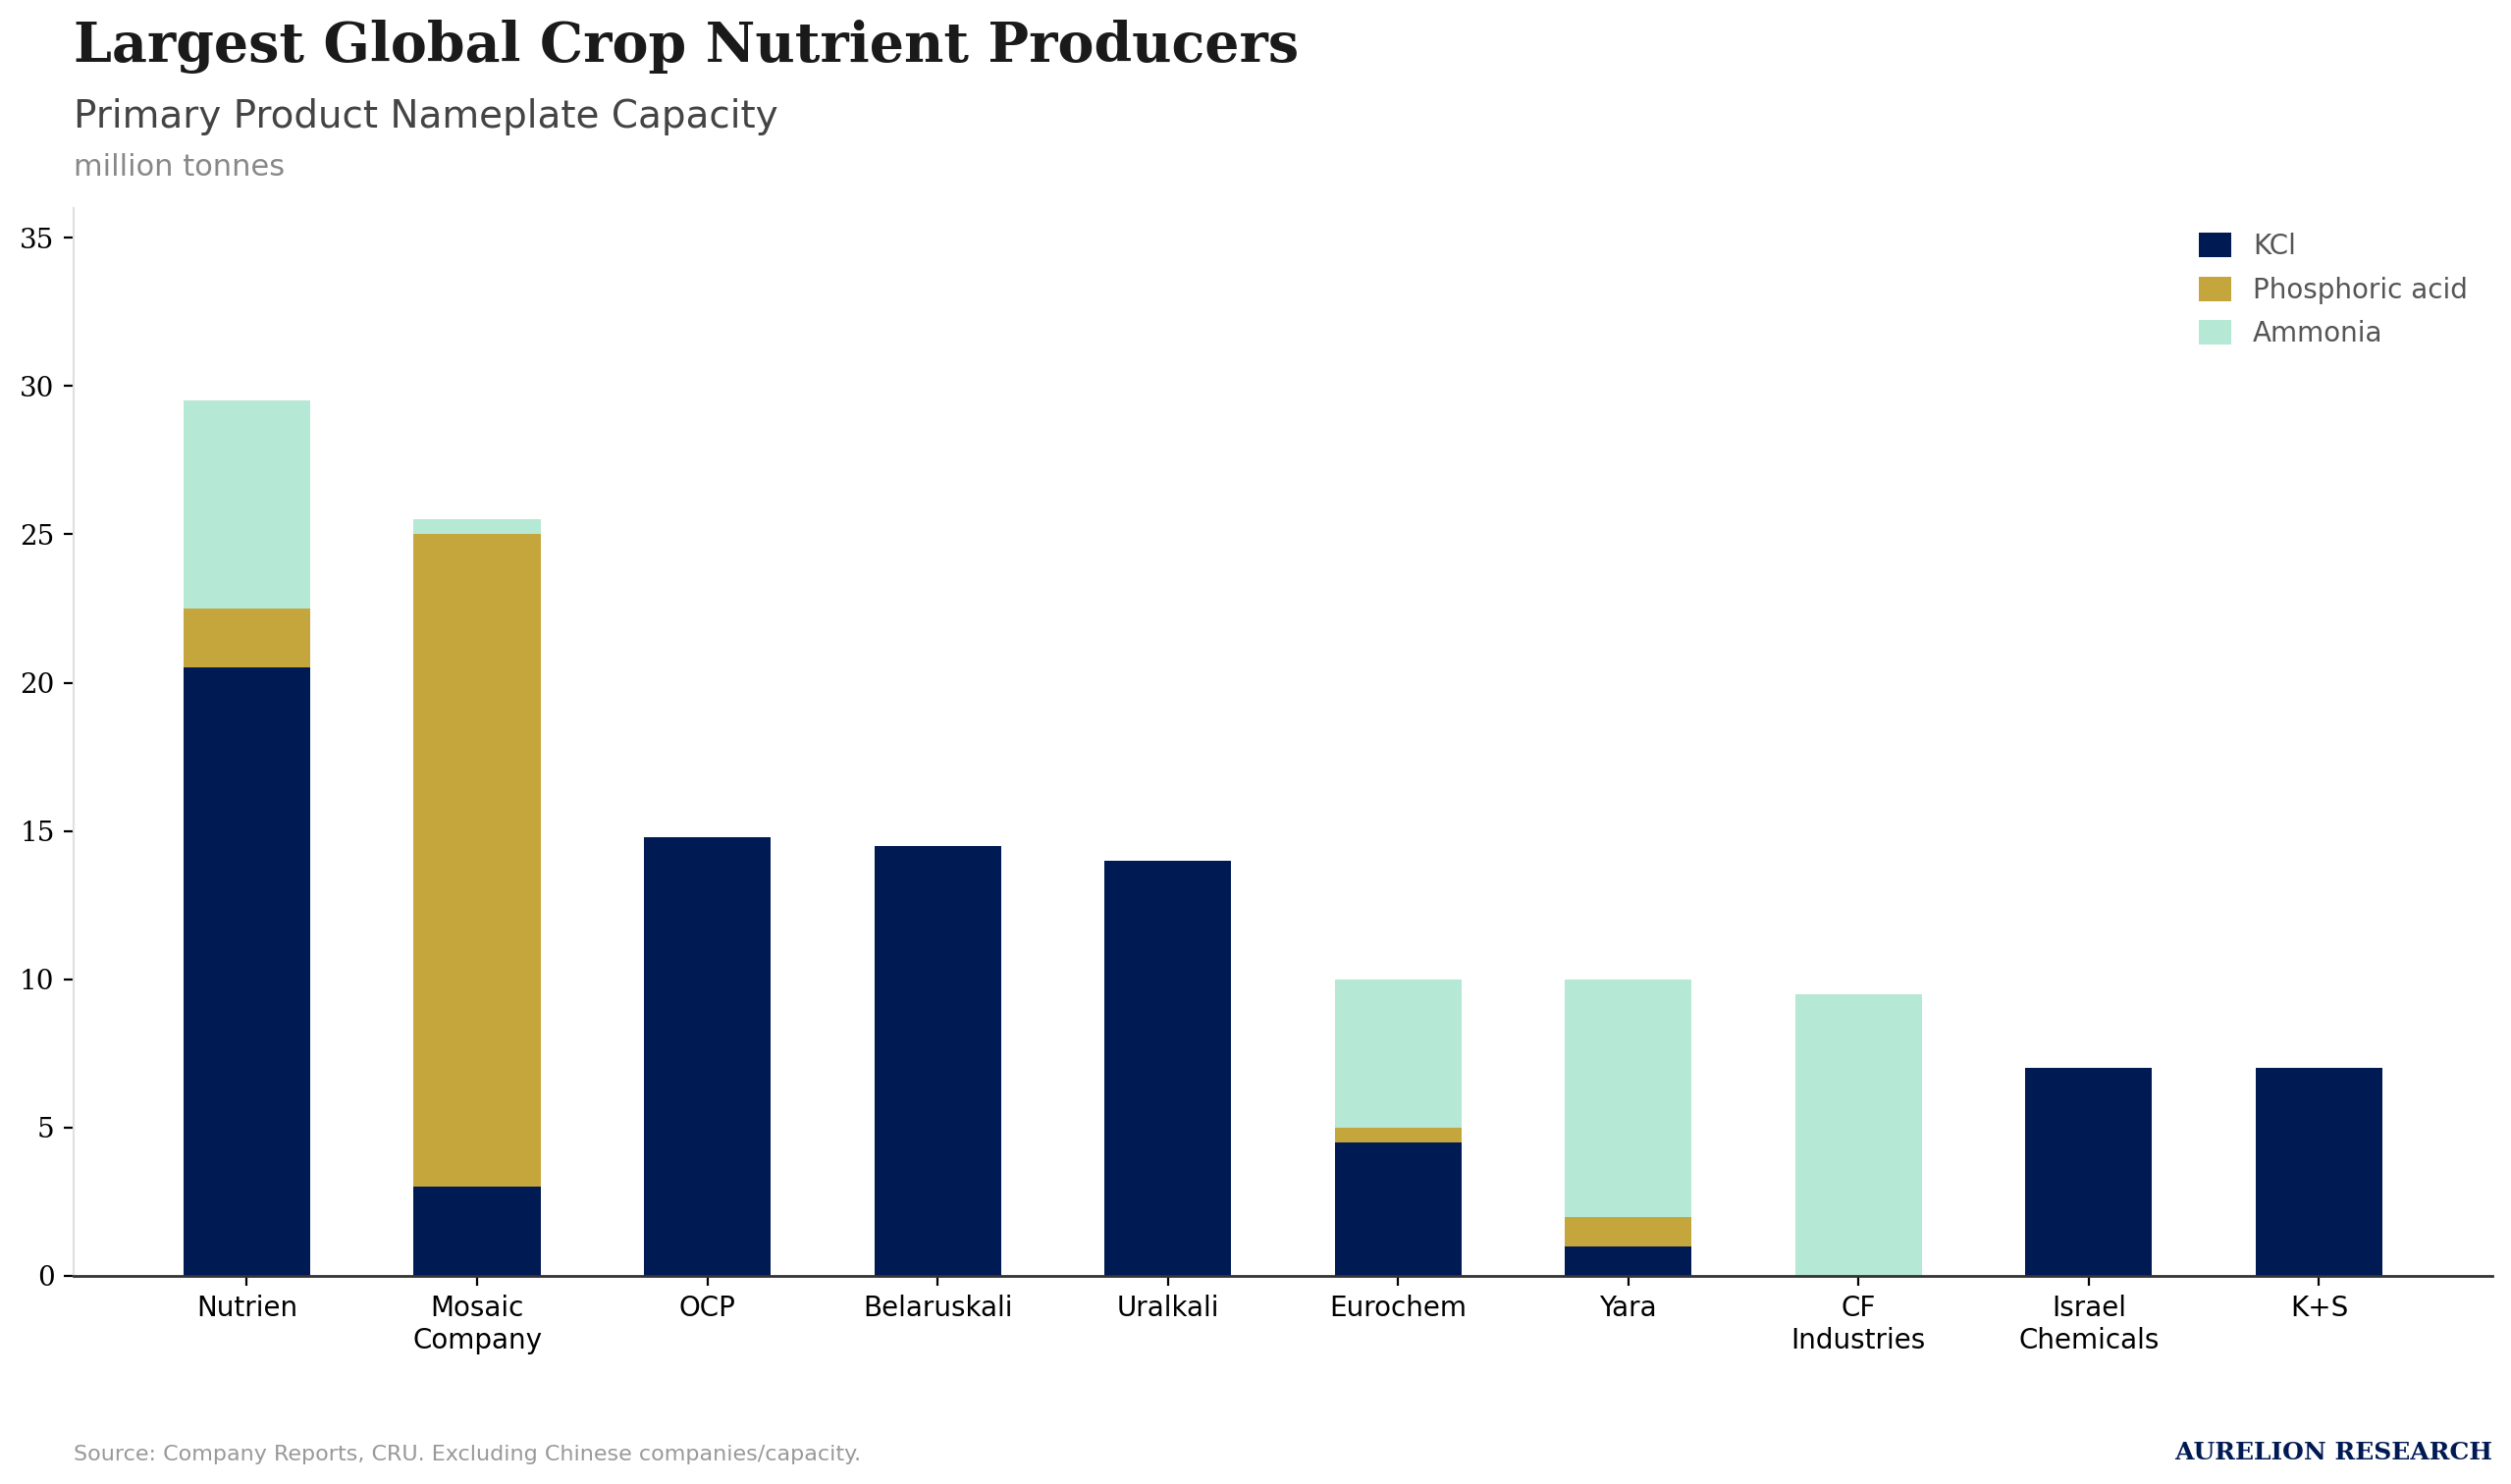
The supply side of the industry is characterized by high concentration, with a small group of Tier 1 producers controlling the majority of global nameplate capacity. Nutrien and Mosaic dominate the potash and phosphate landscapes, while firms like CF Industries and Yara lead in ammonia production.
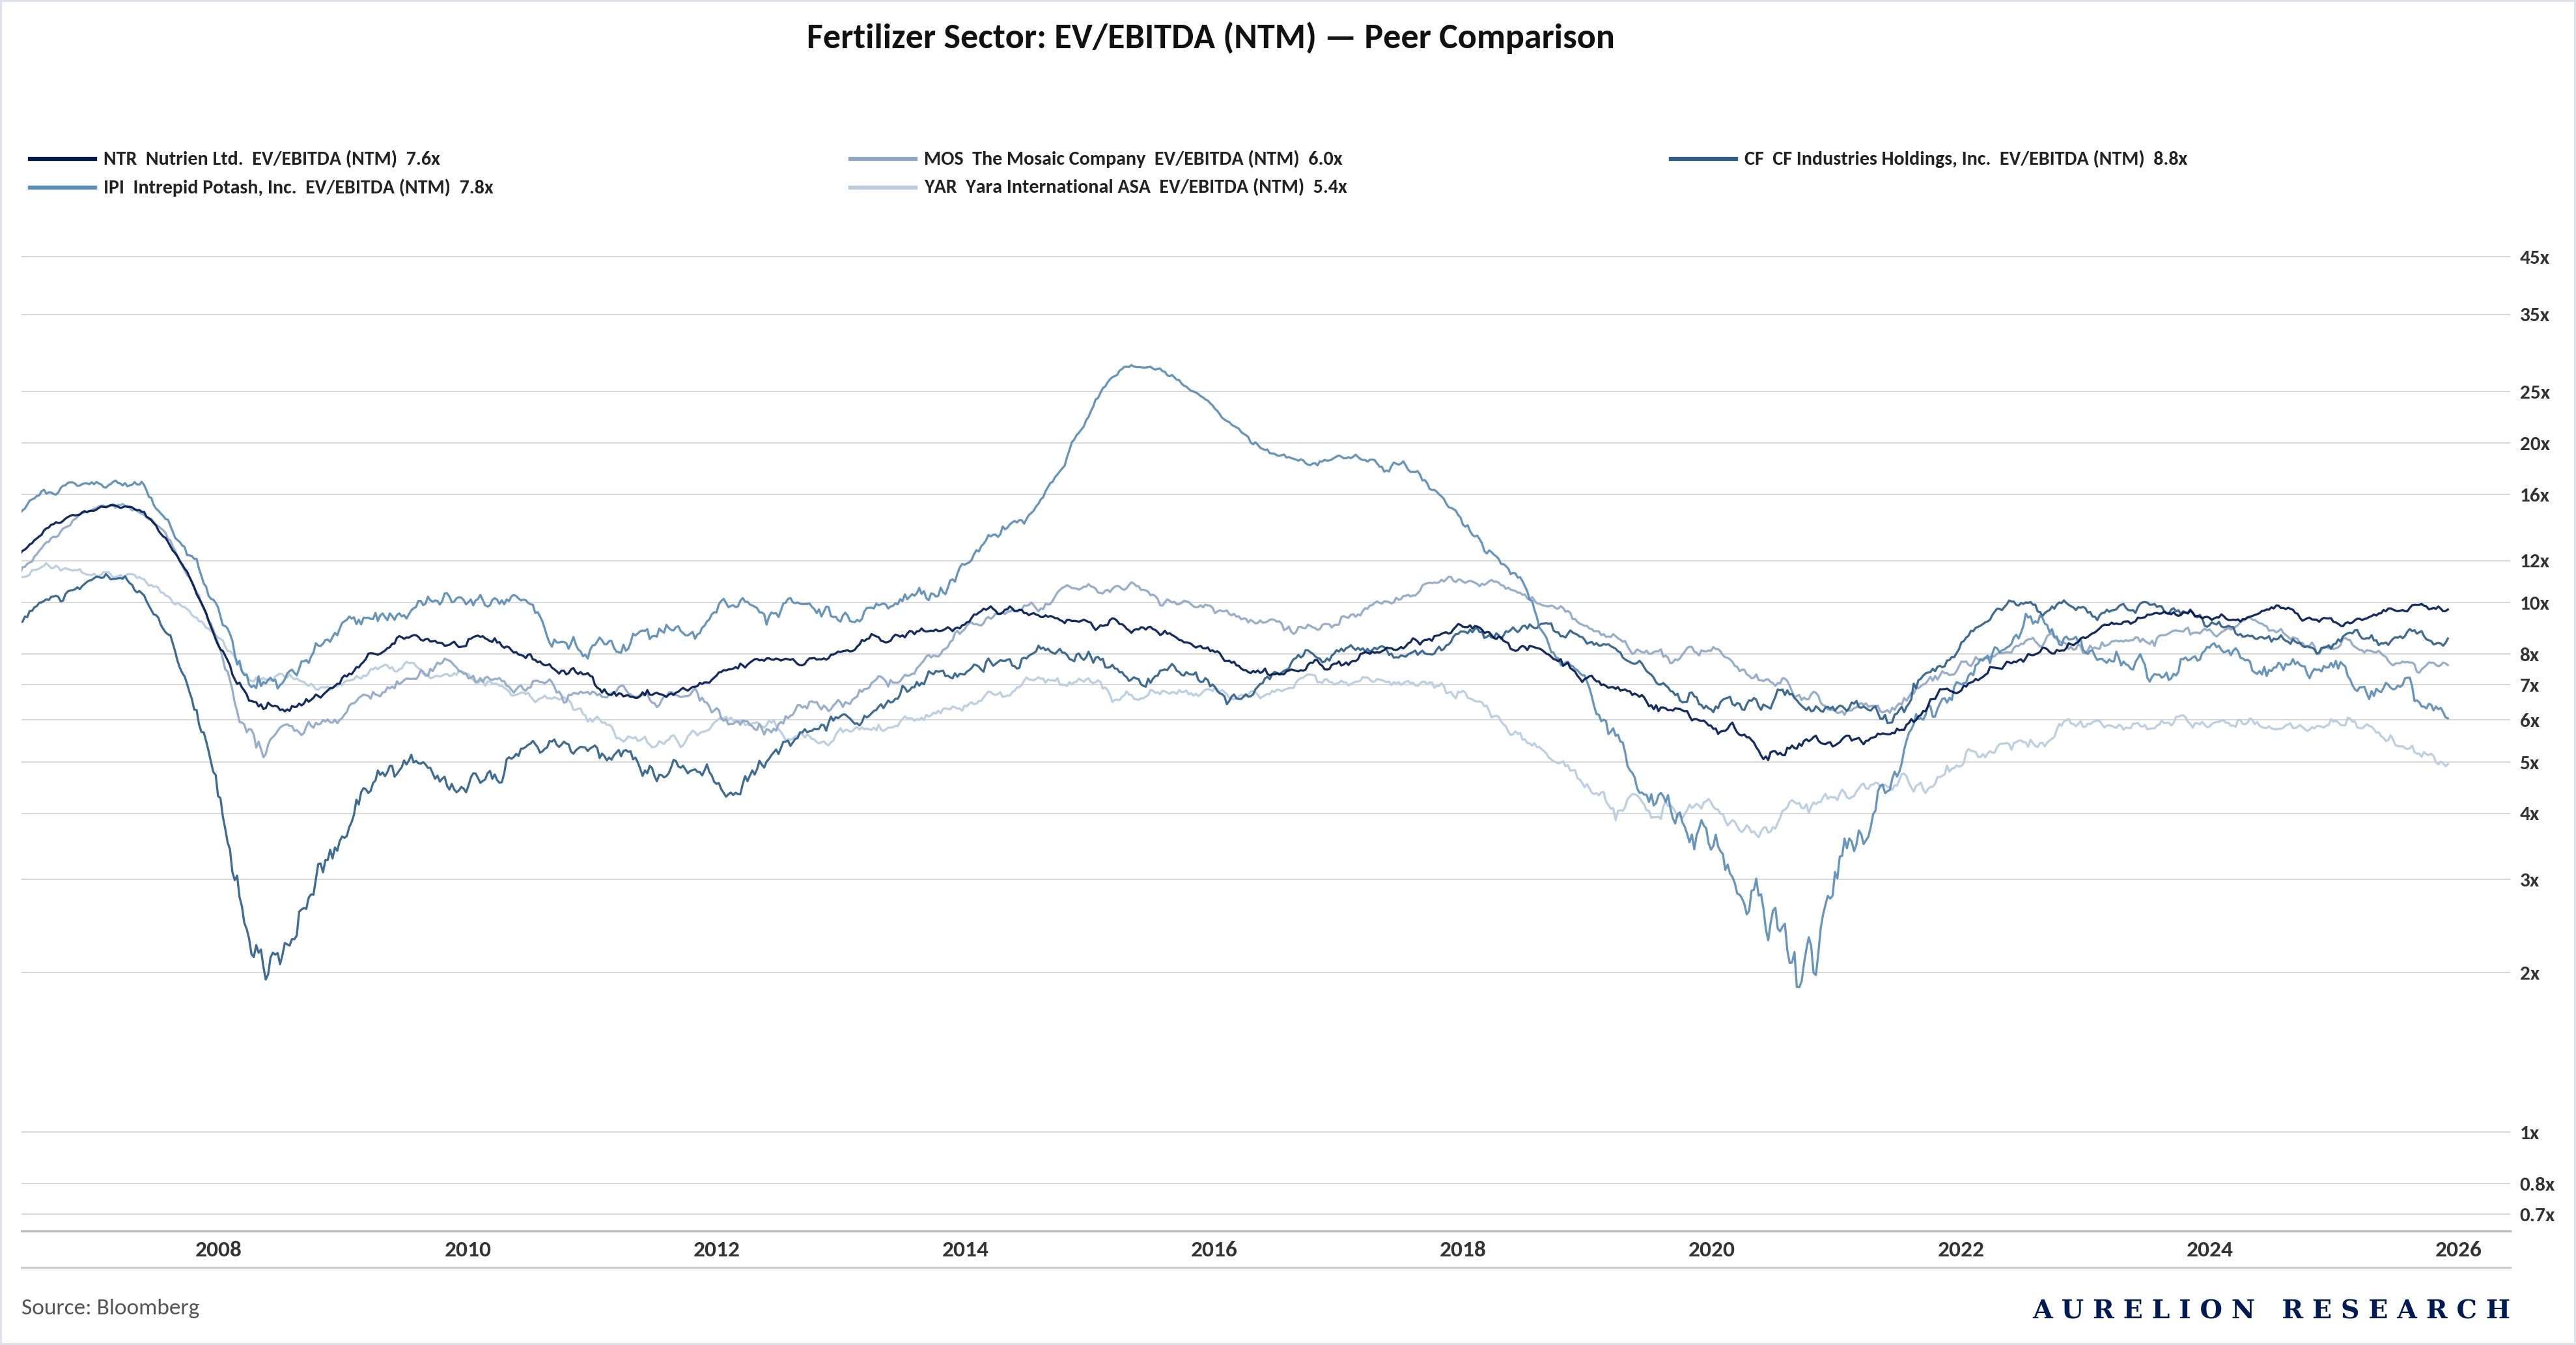
Despite these strong demand fundamentals, equity valuations across the sector are currently trading at a significant discount to historical averages.
As shown in the peer comparison analysis, forward EV to EBITDA multiples for majors like Yara and Mosaic have compressed well below their ten year means. We believe this valuation disconnect suggests the market is pricing in a cyclical downturn that ignores the persistent supply deficits emerging across all three primary nutrient markets.
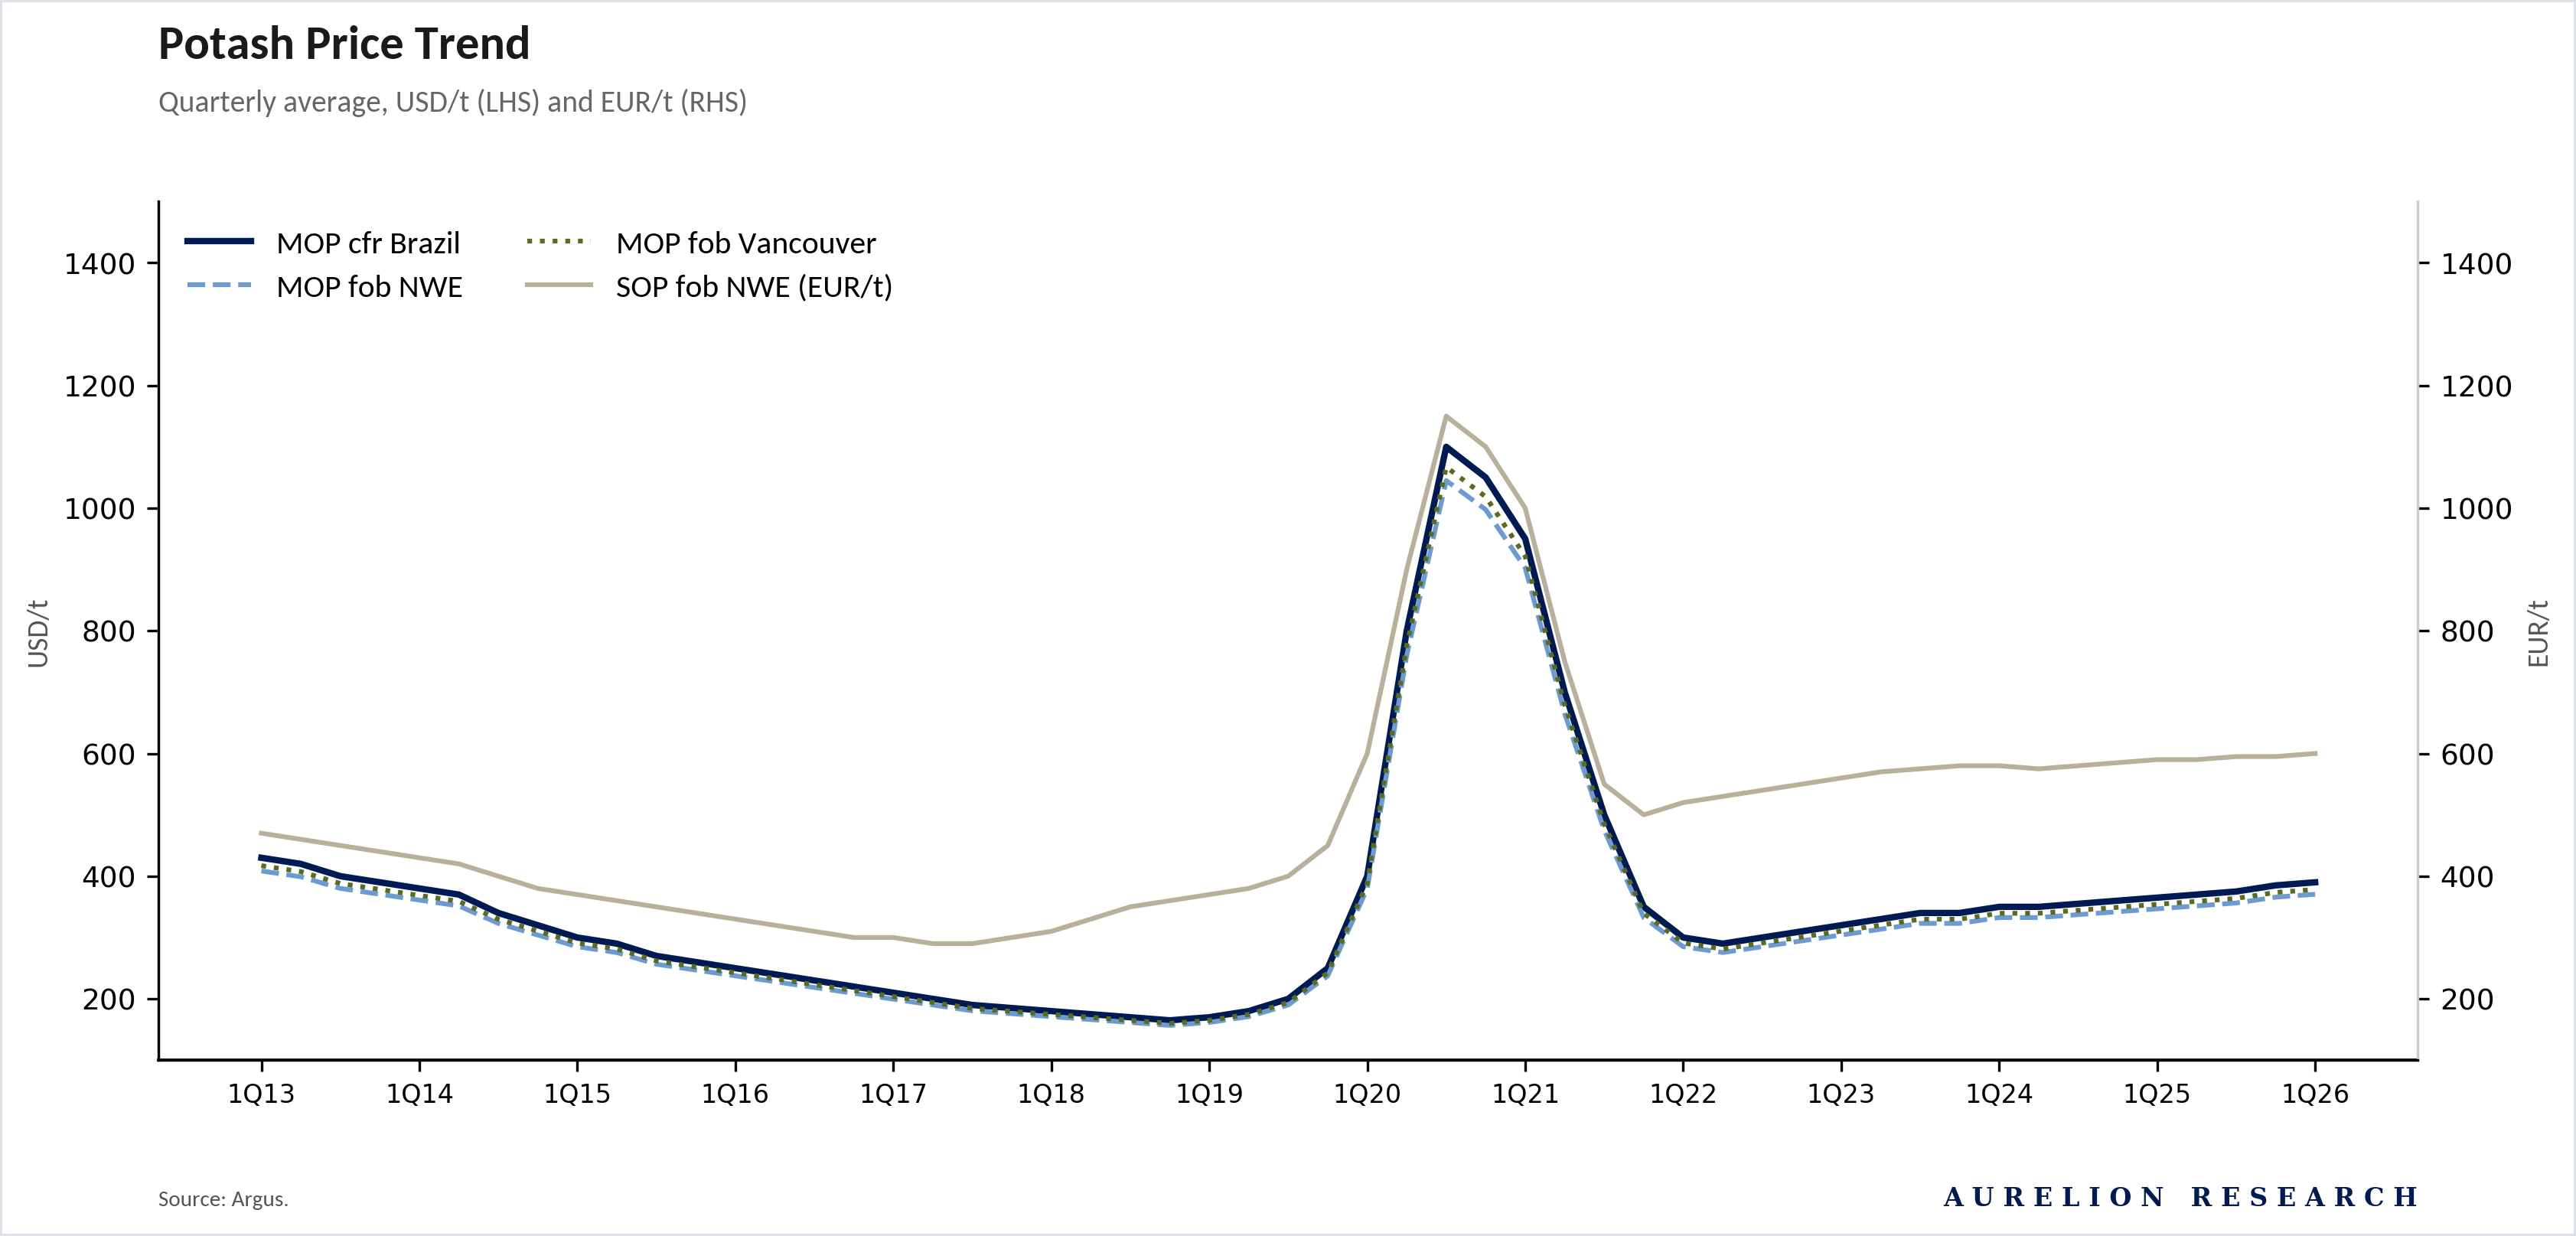
2.1 Potash Outlook
The 2022 price spike is over, but potash has settled into a higher range. After a decade of trading between $200 and $400 per tonne, prices surged above $1,100 per tonne in 2022 when sanctions on Russia and Belarus removed roughly 40% of global export capacity.
That initial shock has passed, and prices are back in the $350-400 range. But they have not returned to the $200 floor seen in 2019 and 2020, and they are unlikely to do so. The cost to produce potash has simply gone up across the industry, and the cheapest mines are already running at full speed.
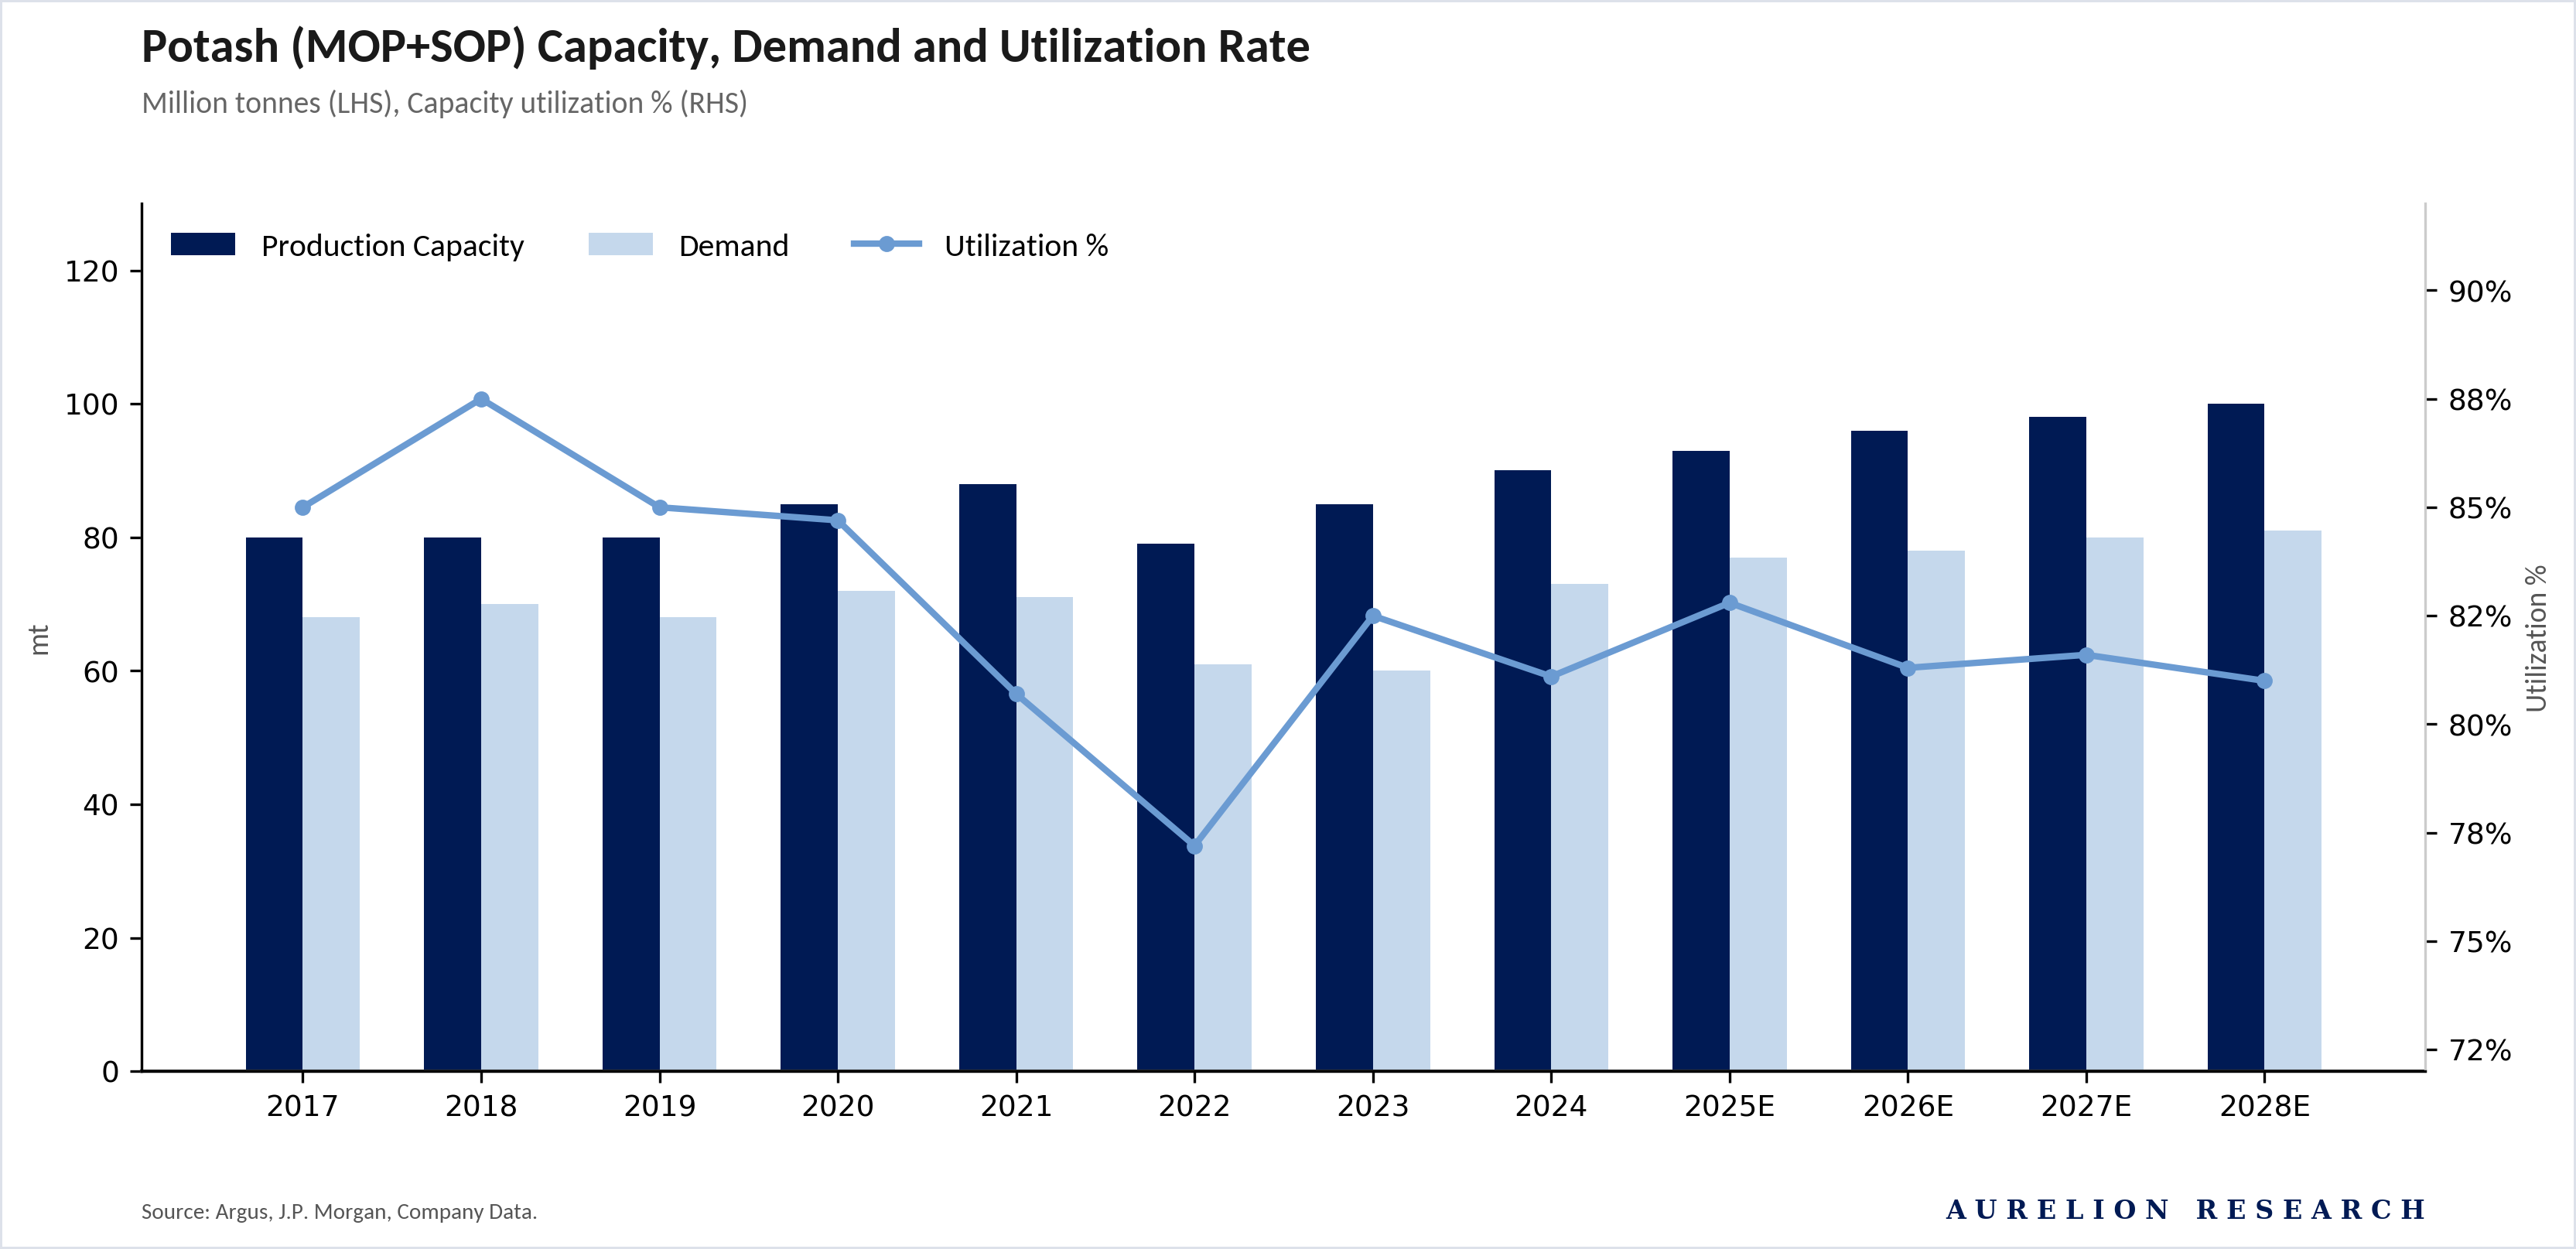
There is enough capacity on paper, but the cushion is thinner than it looks. Global potash capacity has grown from roughly 80M tonnes in 2017 to an estimated 100M tonnes by 2028E. That sounds comfortable.
But utilization tells a more interesting story: after peaking near 88% in 2018, it fell to 75% in 2022 as sanctions and buyer pushback collided. The recovery has been slow, settling in the low 80s, and forecasts keep it there through 2028. In a commodity with concentrated supply and long lead times for new projects, an 80% utilization rate leaves less room than it suggests.
A single major producer pulling back could move the market.
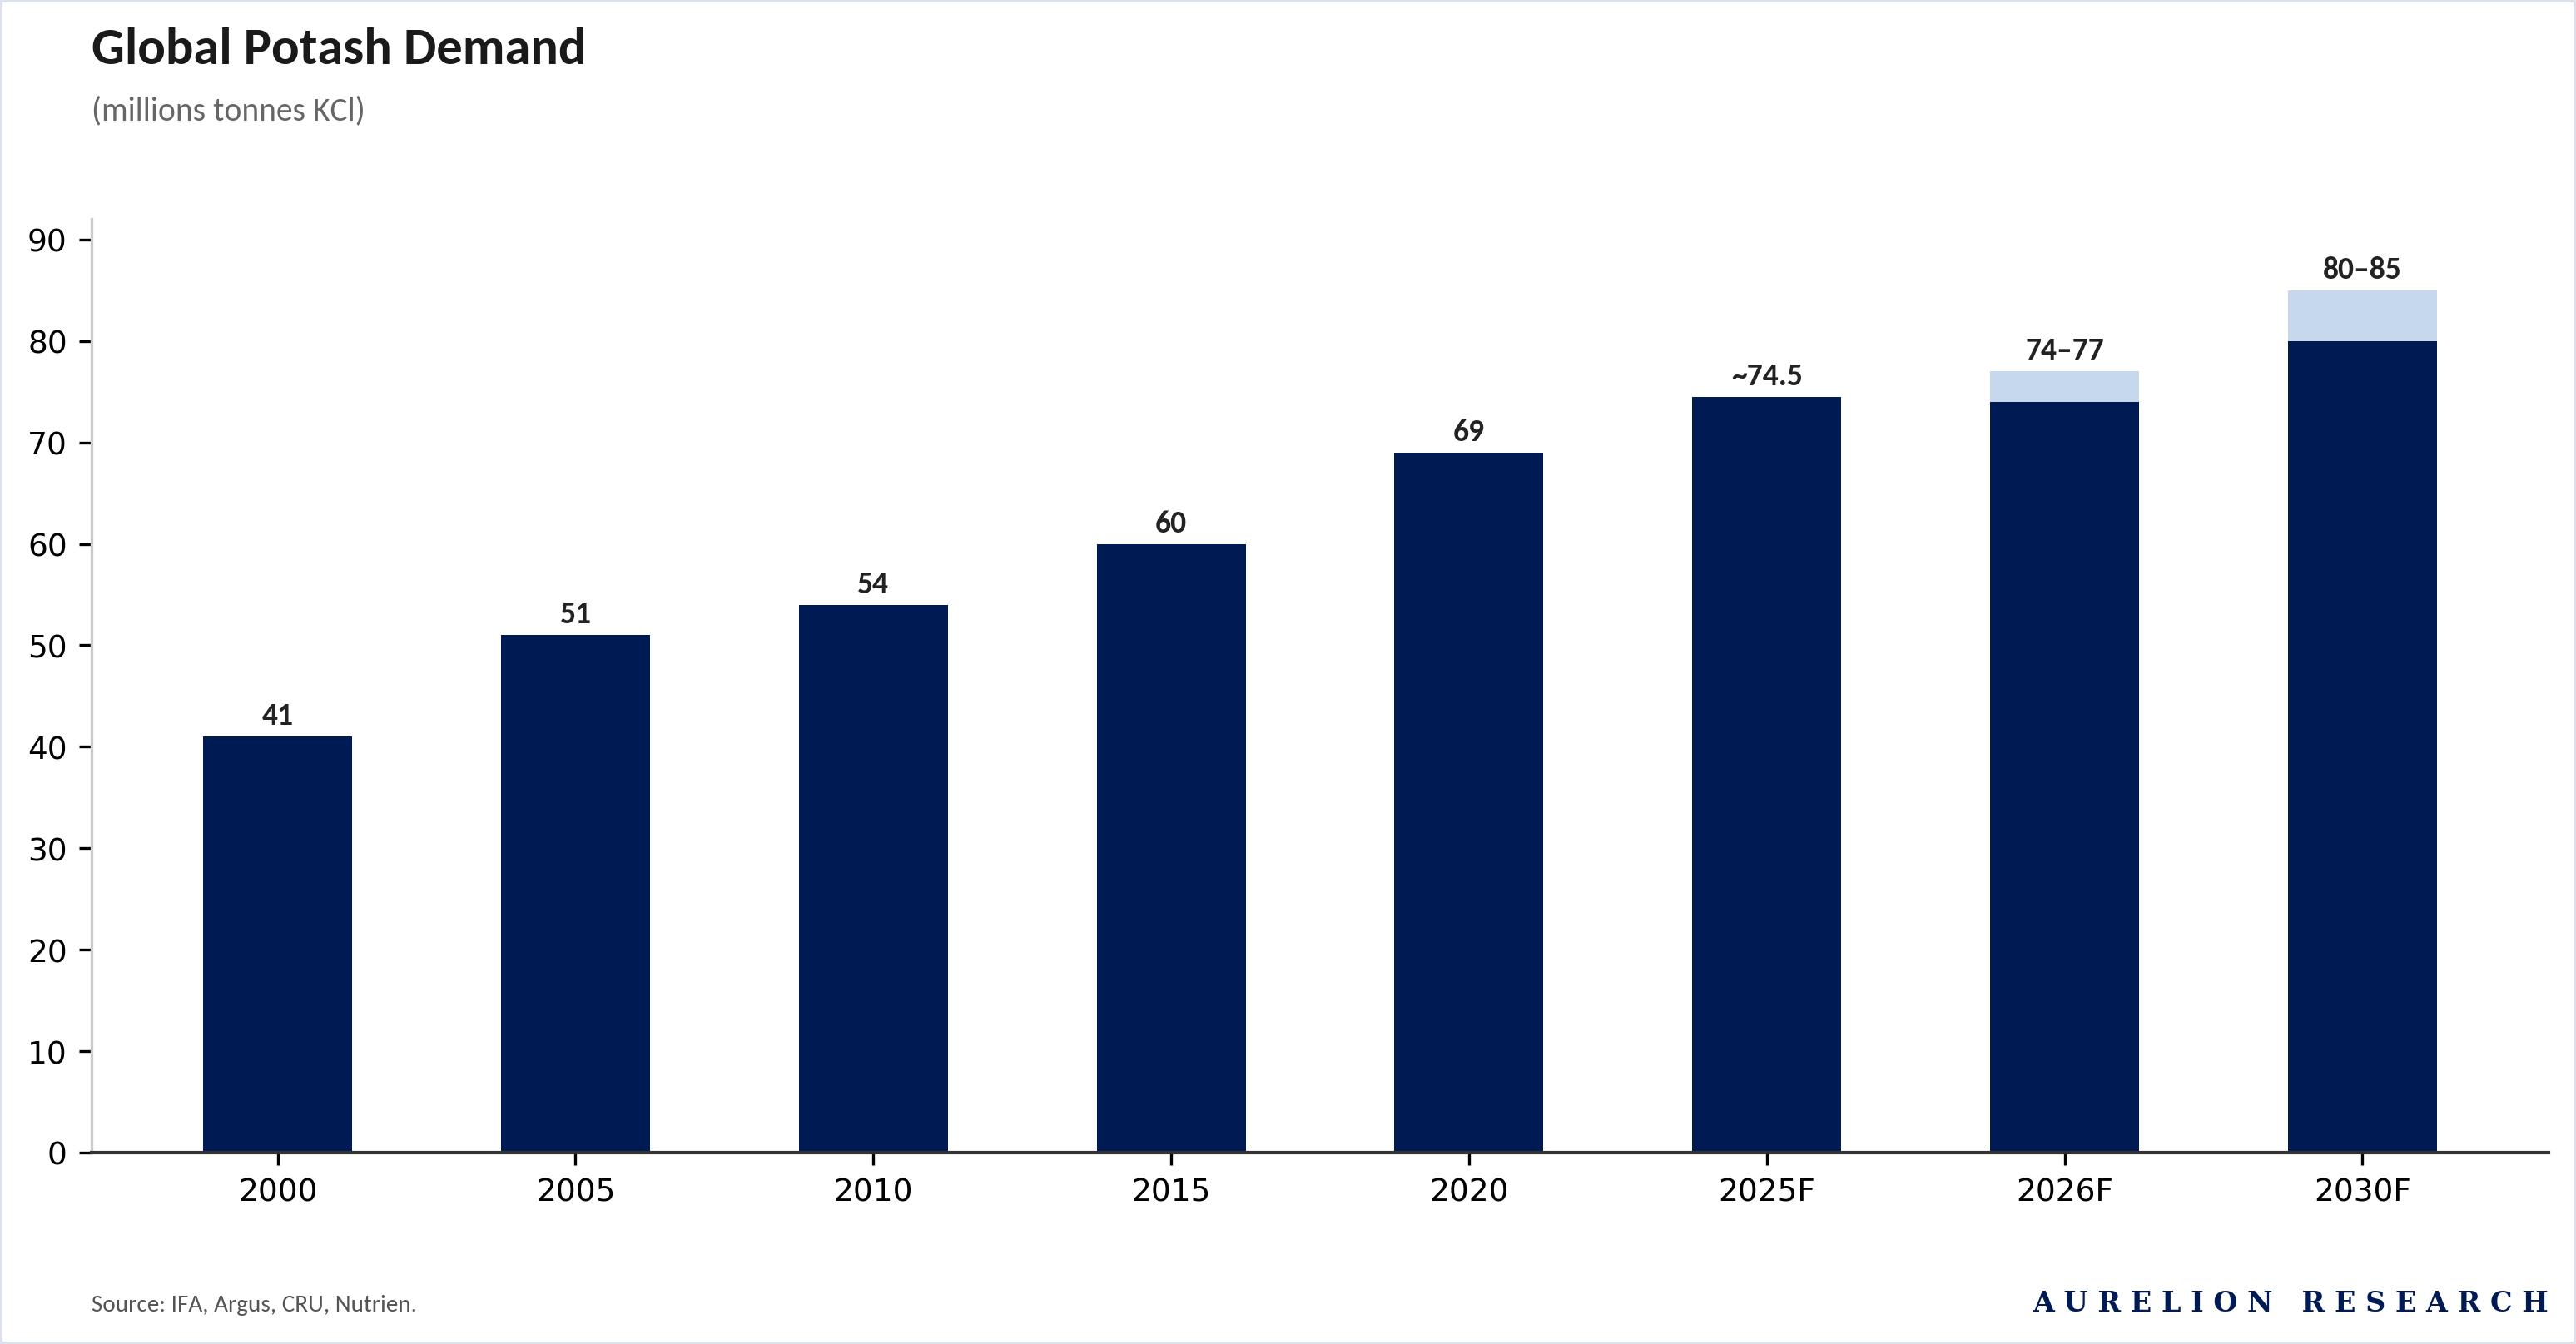
Potash Demand: Two Main Buyers and a Fast Growing Third
Global potash demand has shown consistent growth, doubling since 2000. Current projections suggest the market will reach the 80-85M tonne mark by 2030. This upward trend reflects the essential role of potash in maintaining soil health and crop yields as global food requirements expand.
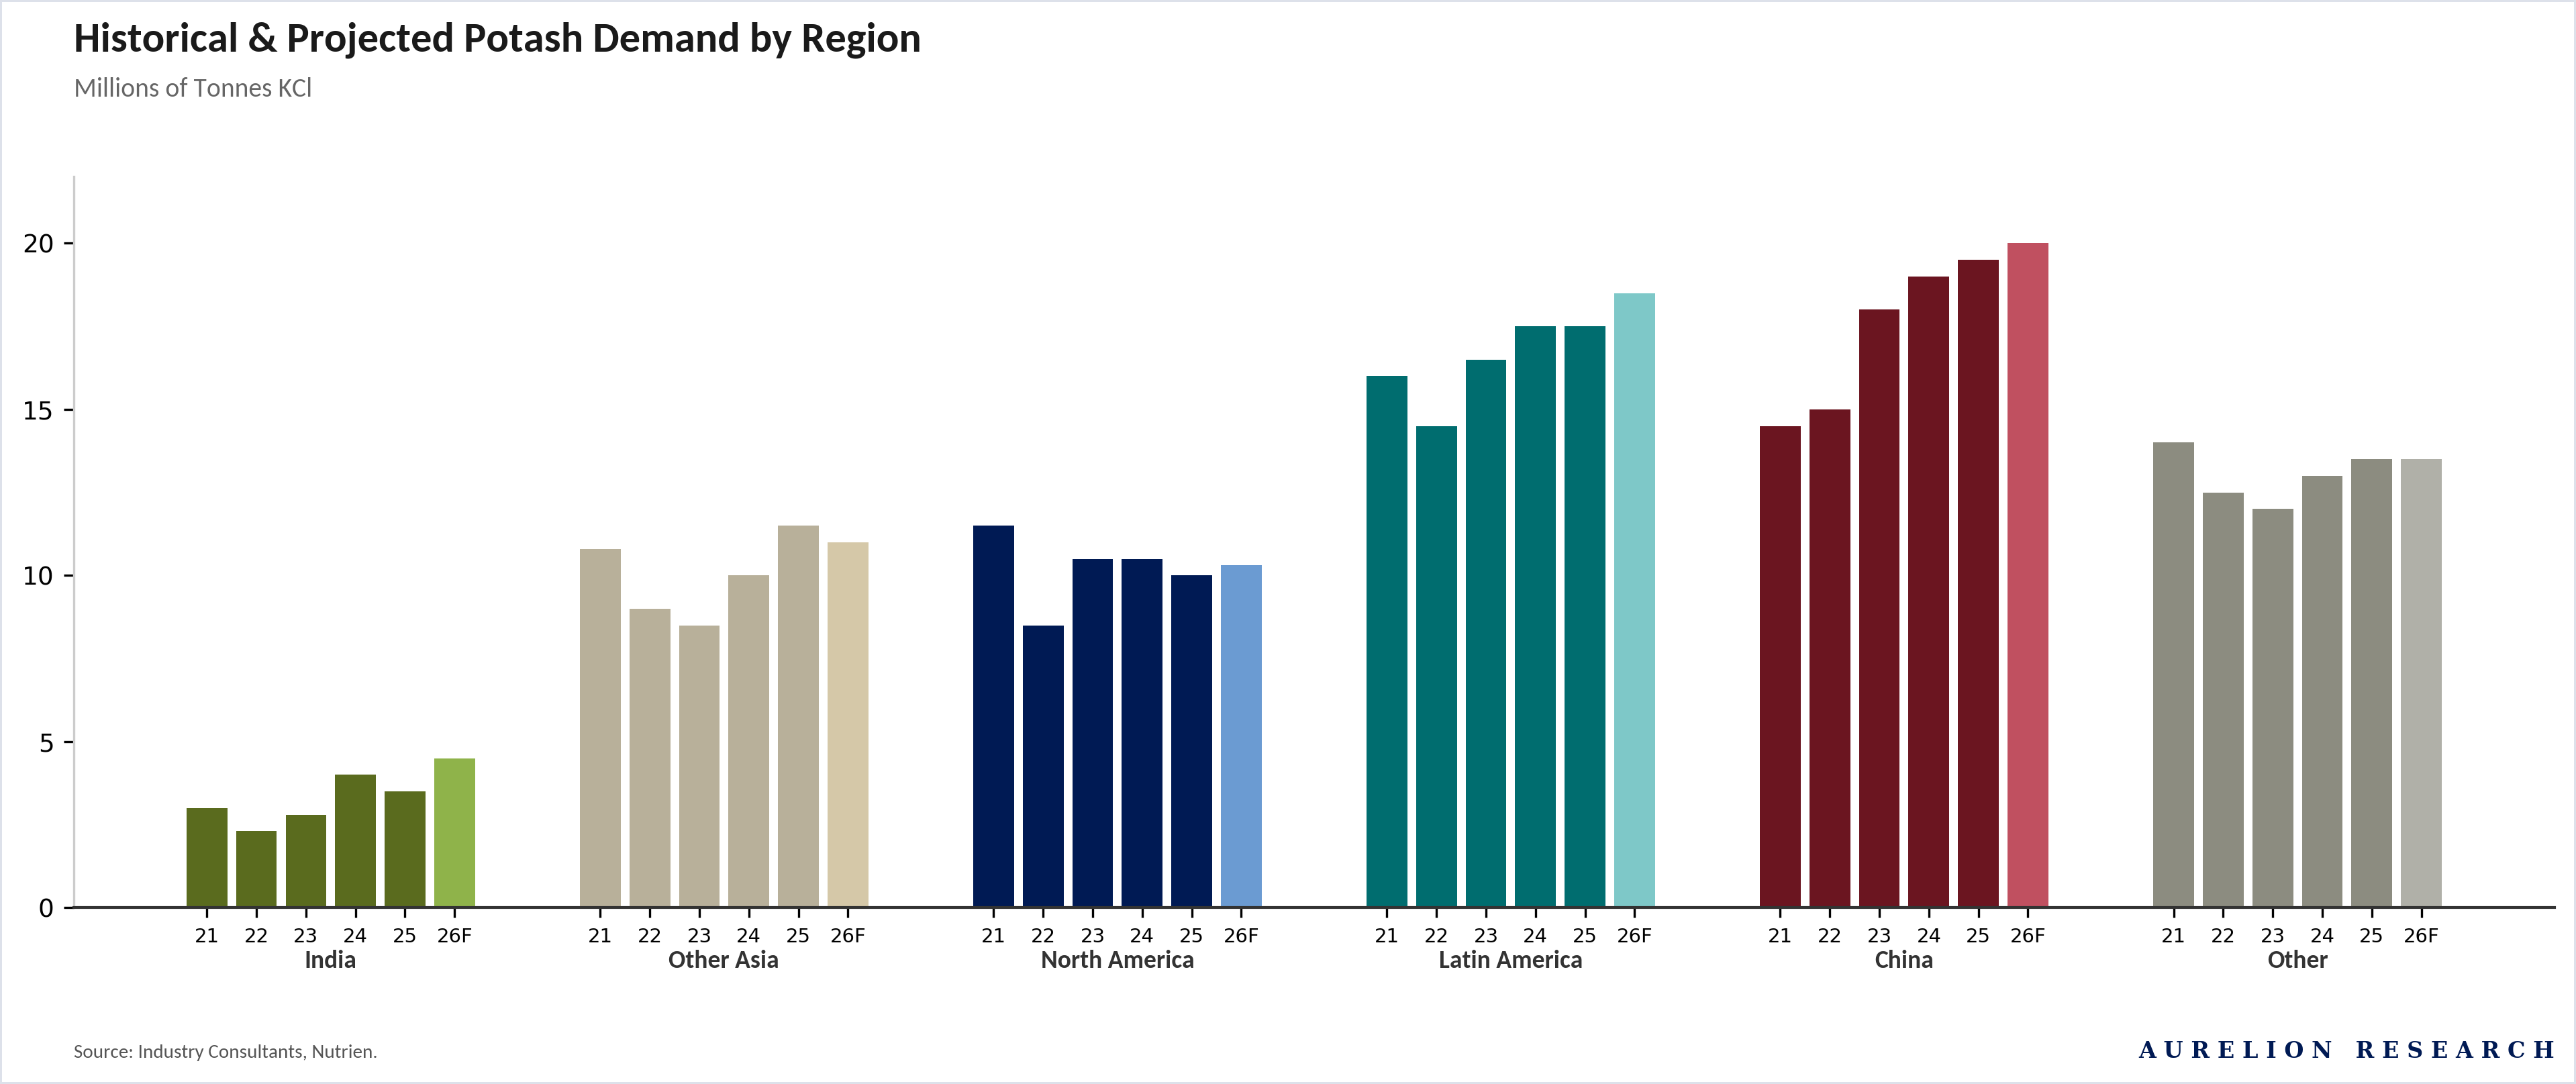
Two regions run the demand story, and a third is emerging fast.
China and Brazil each consume close to 20M tonnes annually and together account for the bulk of global trade. North America and Other Asia have been relatively flat. India is the one to watch. The country has nearly doubled its potash imports since 2021, driven by agricultural intensification, potassium-depleted soils and government policy pushing for higher crop yields.
Brazil’s cost curve is the best guide to where prices are heading. Brazil imports almost all of its potash and buys more than any other single country.
Because of this, the price it costs to deliver potash to Brazil is the best indicator for global pricing. Short term costs have risen from $215 per tonne in 2020 to $270 per tonne in 2025, and are expected to reach $315 per tonne by 2030. Long term costs, which represent the price needed to justify building a brand new mine, have climbed from $395 to $480 per tonne over the same period, heading toward $545 by 2030.
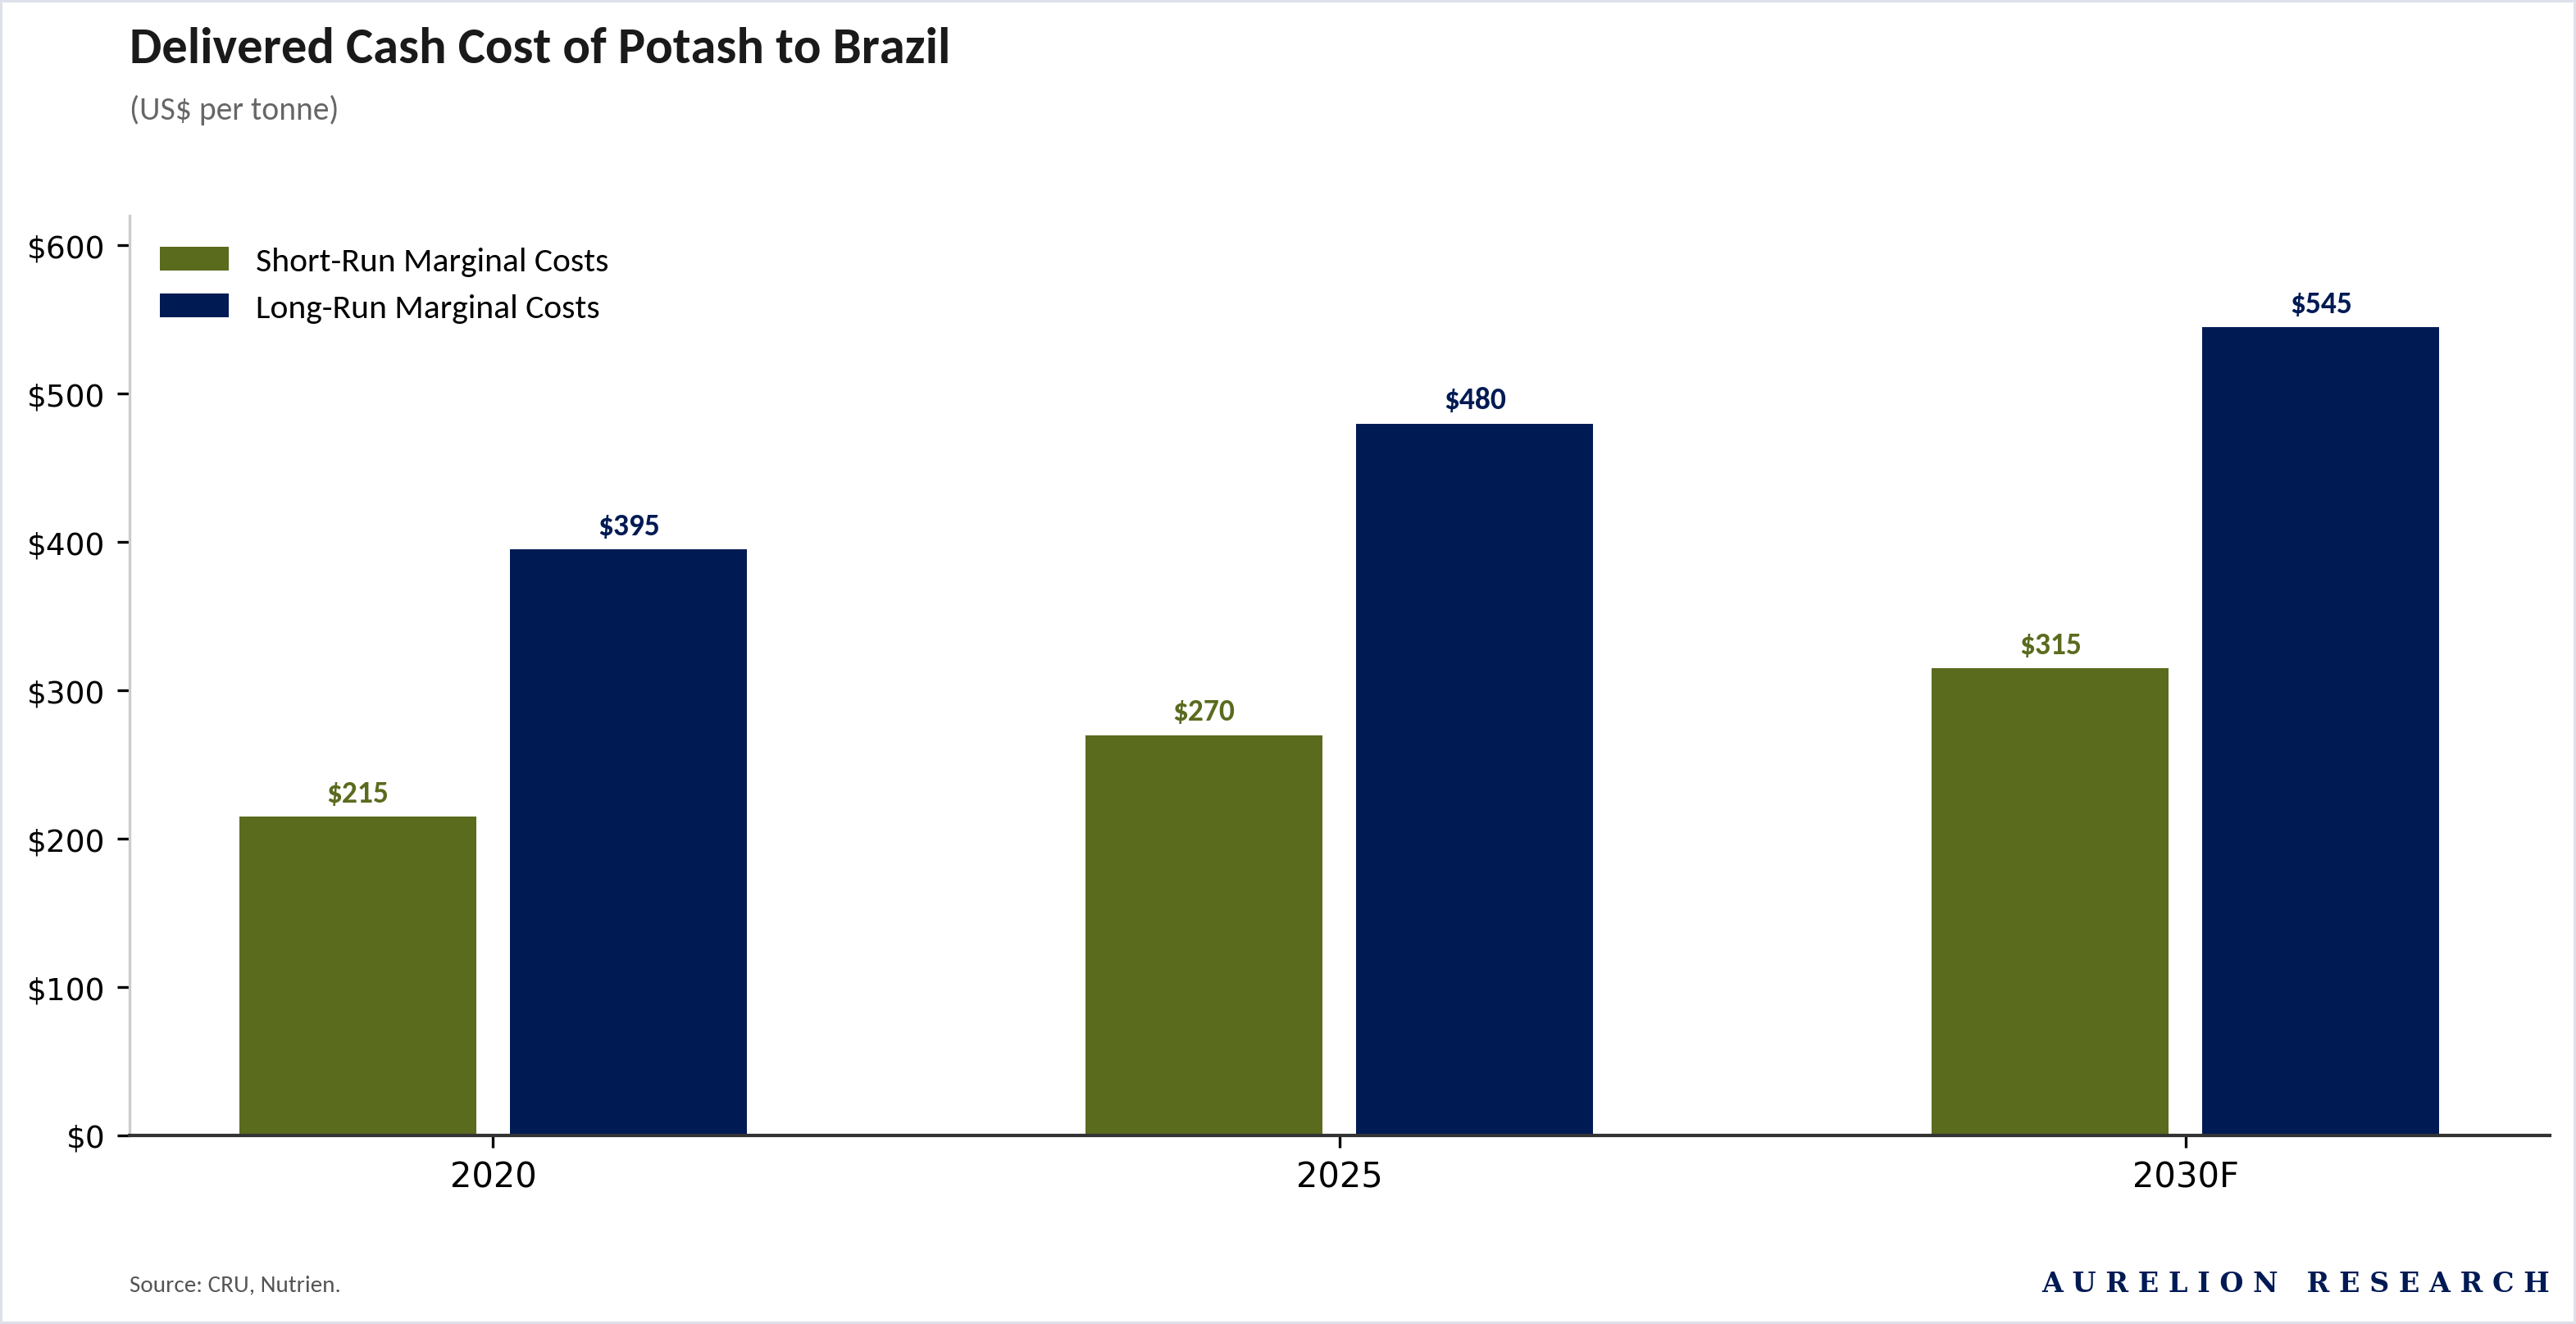
Current spot prices sit above short term costs, so existing producers are earning healthy profits. But prices sit below the long term cost of new supply, which means companies have no financial reason to build new mines.
That gap can last for a while. Eventually, growing demand will force the issue: either prices must go up to encourage new mines to be built, or the market will just keep getting tighter.
The Bottom Line on Potash
This segment has the least direct risk from shipping issues in the Middle East, given that production is concentrated in Canada, Russia, Belarus, and China. But the longer term picture is attractive: demand is growing at ~2% a year, utilization sits in the low 80s with very few new mines being approved, and the cost to produce keeps rising.
The biggest risk remains Russian & Belarusian supply. Those two countries caused the 2022 price shock, and their continued access to global markets is uncertain. Any new disruptions would tighten the market quickly. And this time around, there would be less backup capacity available to absorb the hit.
2.2 Nitrogen Outlook
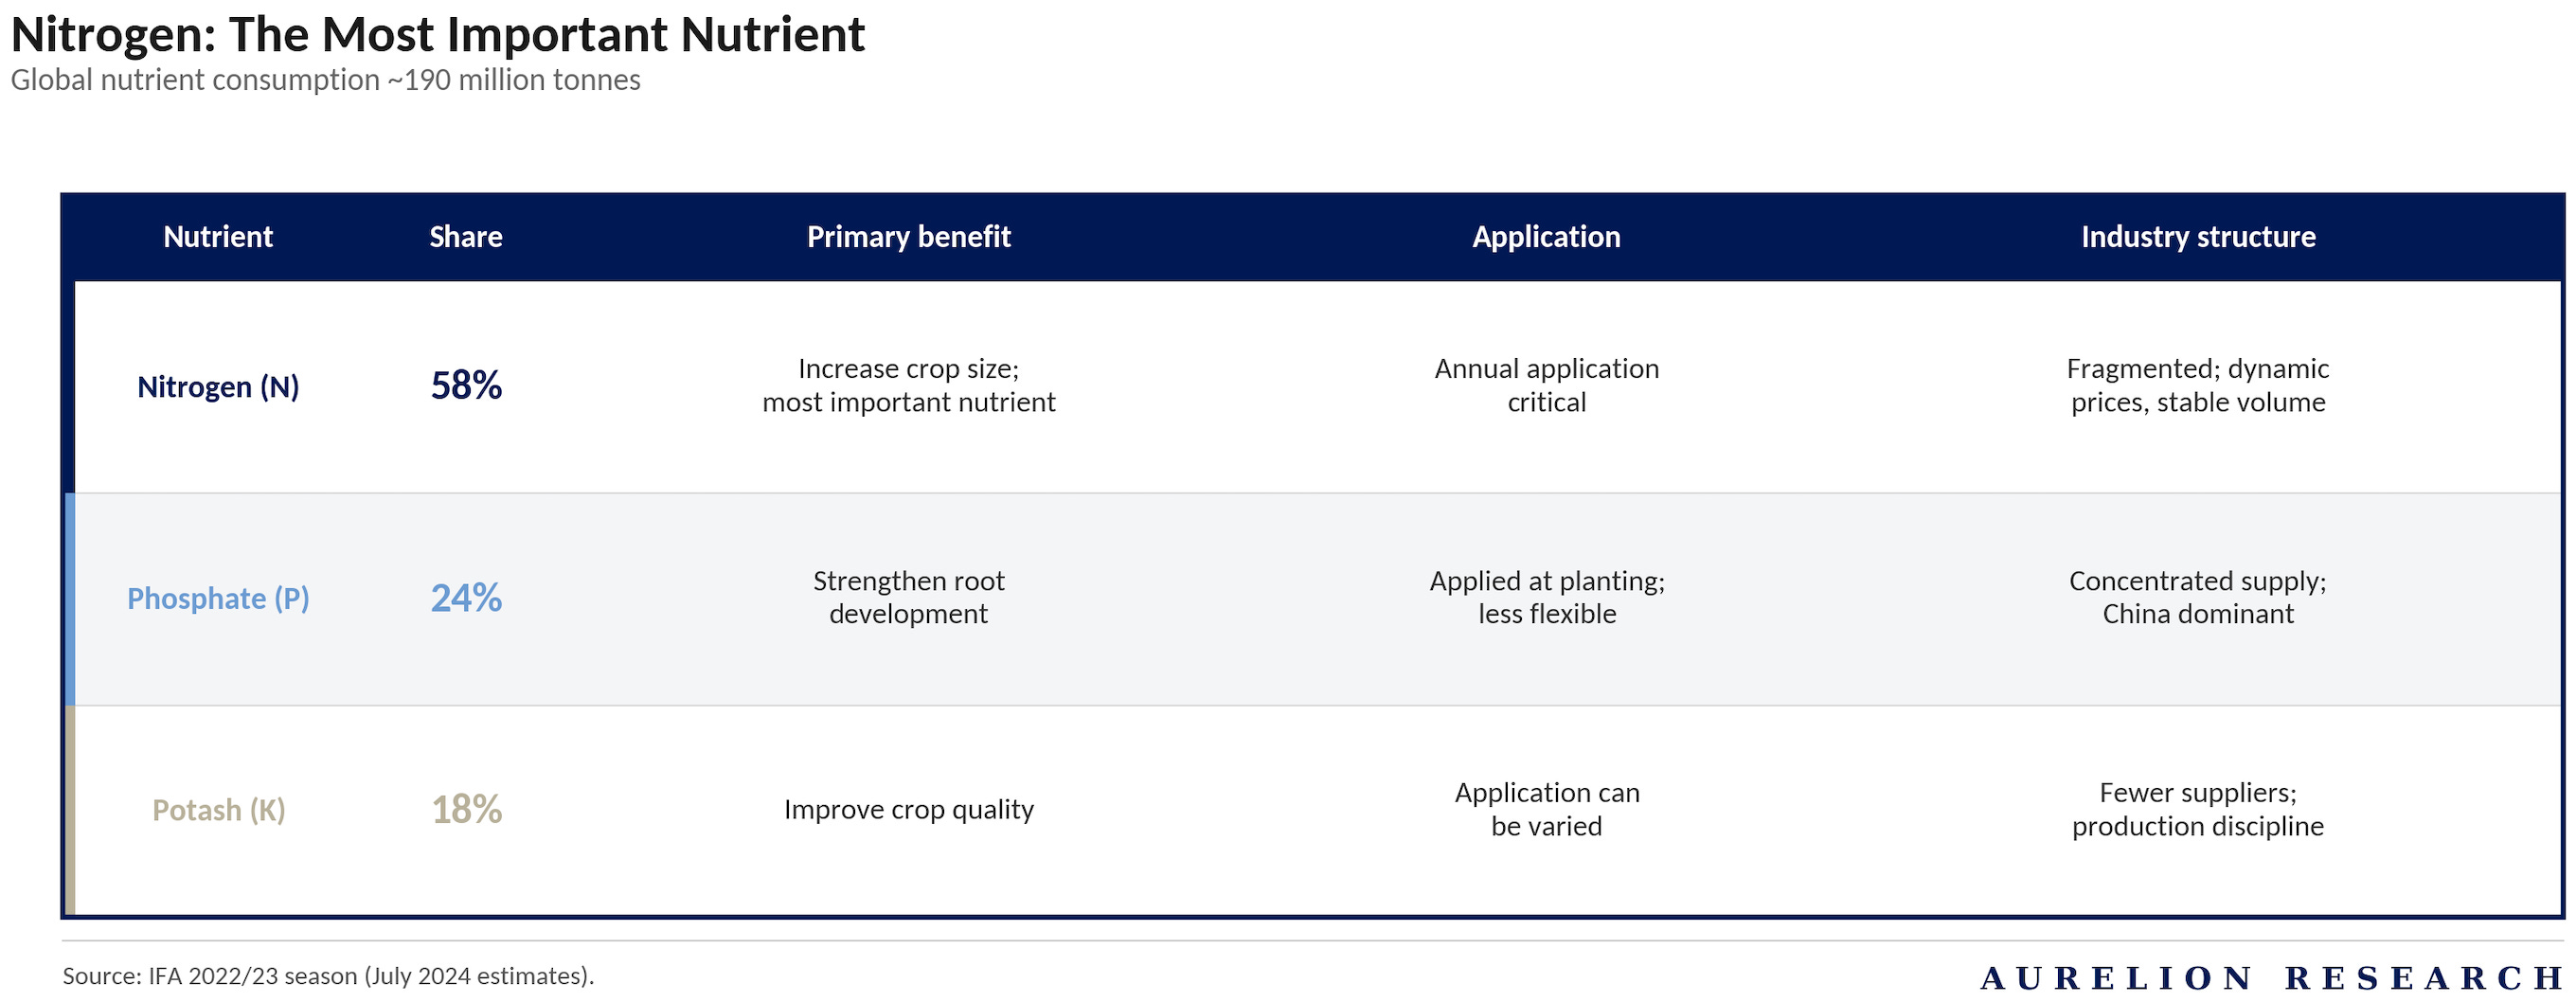
Nitrogen is the most important nutrient in agriculture, and the most exposed to the current crisis. At 58% of global nutrient consumption, nitrogen dwarfs phosphate (24%) and potash (18%). It is applied annually, demand is relatively stable, and farmers cannot skip it without immediate yield consequences. That combination of scale and inelasticity is precisely why the Persian Gulf disruption has hit nitrogen prices the hardest.
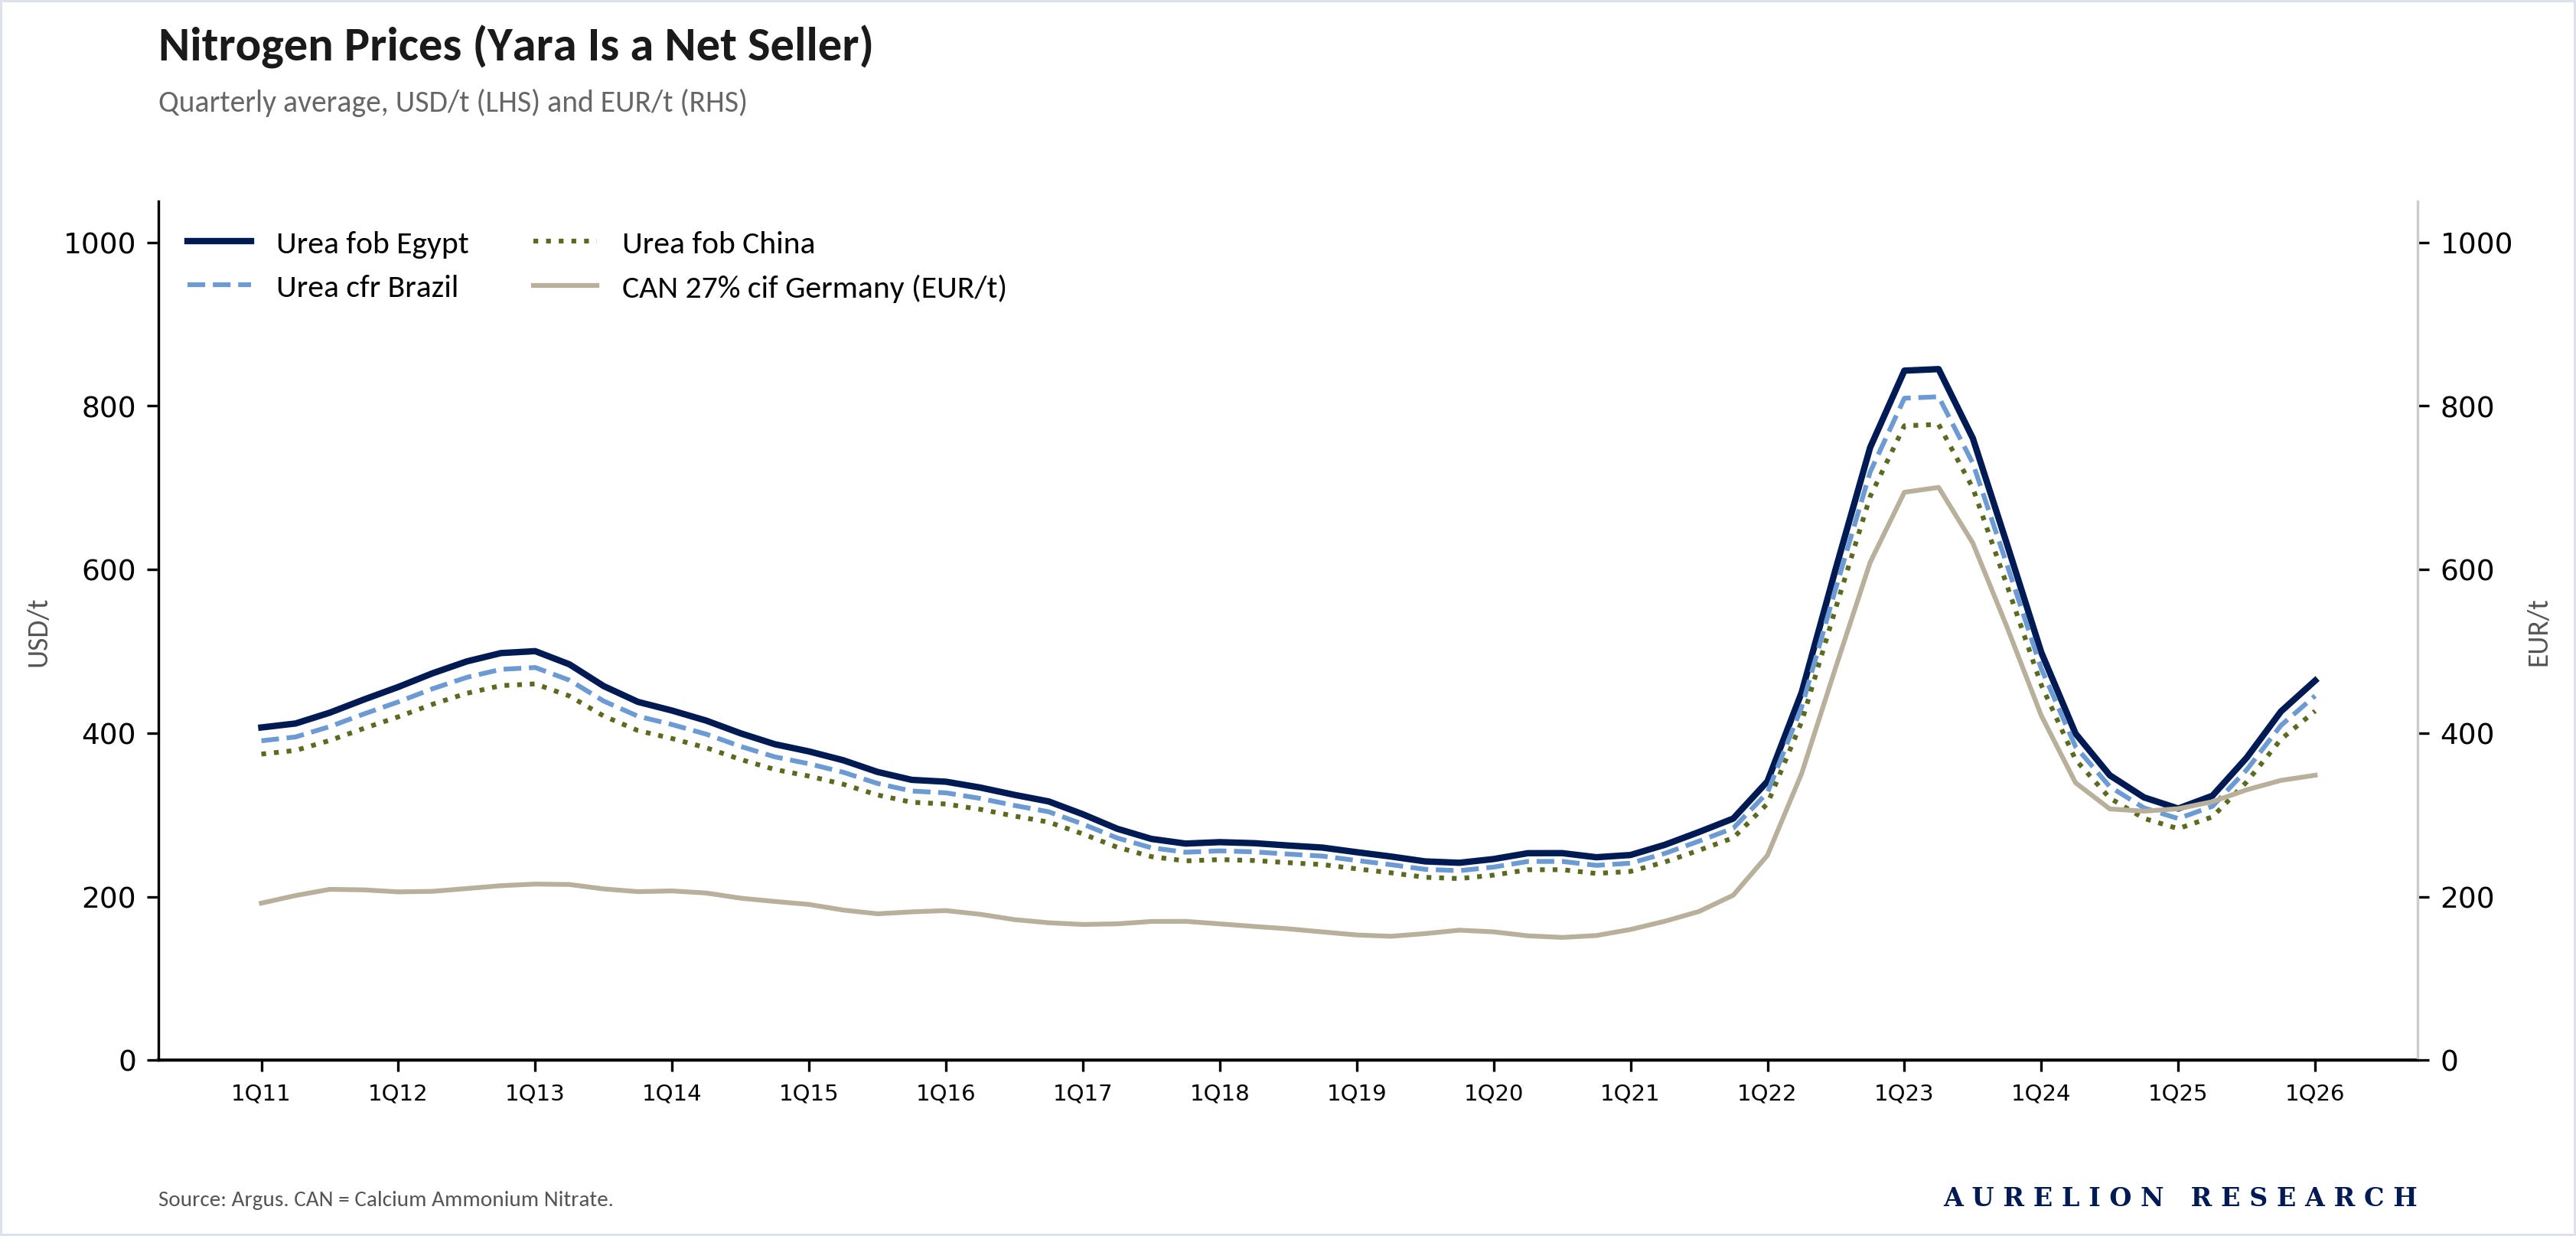
Prices are spiking again, and the pattern looks familiar. Urea prices across all major benchmarks (fob Egypt, fob China, cfr Brazil) traded in a $150-300/t range from 2015 through 2020, before surging above $800/t during the 2022 energy crisis. Prices corrected through 2023-25, but never returned to pre-Covid levels. Now, with the Strait of Hormuz disrupted, urea is moving sharply higher again. The chart title says it well: Yara, the world’s largest nitrogen seller, is a net seller into this environment.
Understanding nitrogen economics is simple: it starts and ends with gas. The value chain runs from natural gas to ammonia to finished products (urea, nitrates, UAN). Gas is both the feedstock and the energy source, typically representing 70-80% of the cash cost of ammonia production.
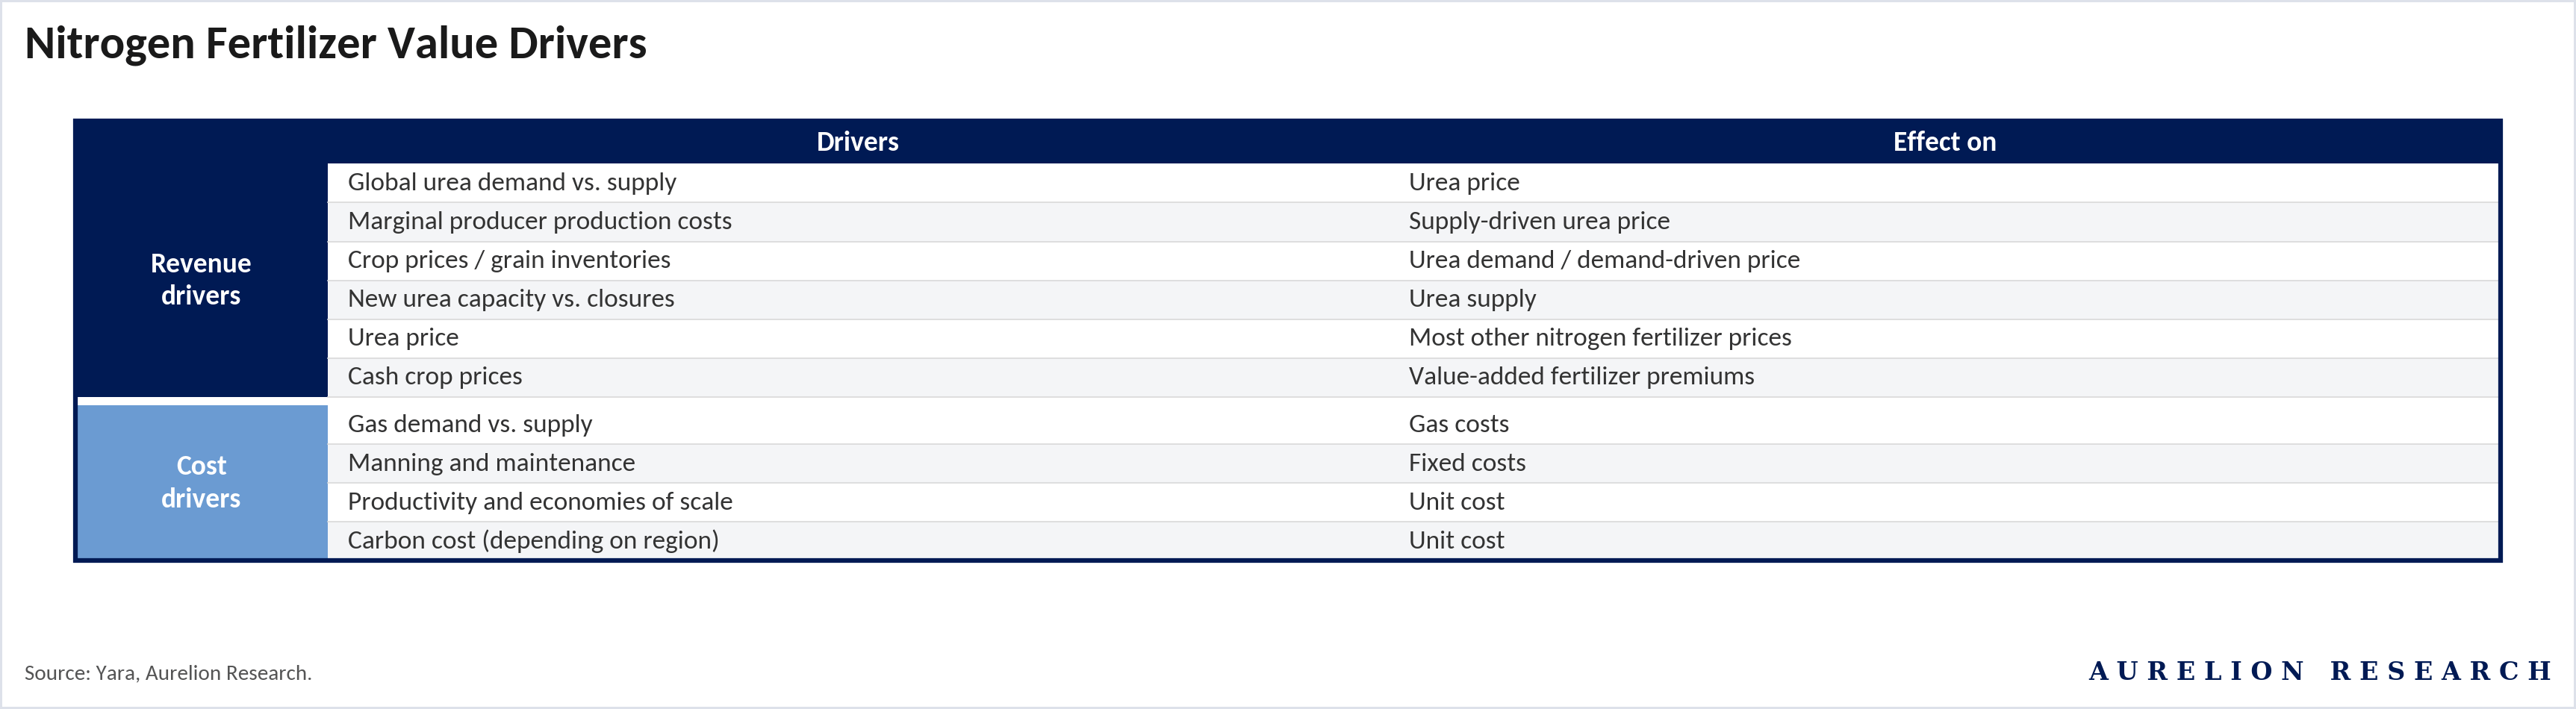
This means nitrogen fertilizer prices are fundamentally a function of regional gas prices, and producers with access to cheap gas (Middle East, US, Russia) enjoy a large and persistent cost advantage over those relying on more expensive supply (Europe, India). On the revenue side, urea is the benchmark price that pulls all other nitrogen products along. Crop prices and grain inventories drive demand, while capacity additions and closures drive supply.
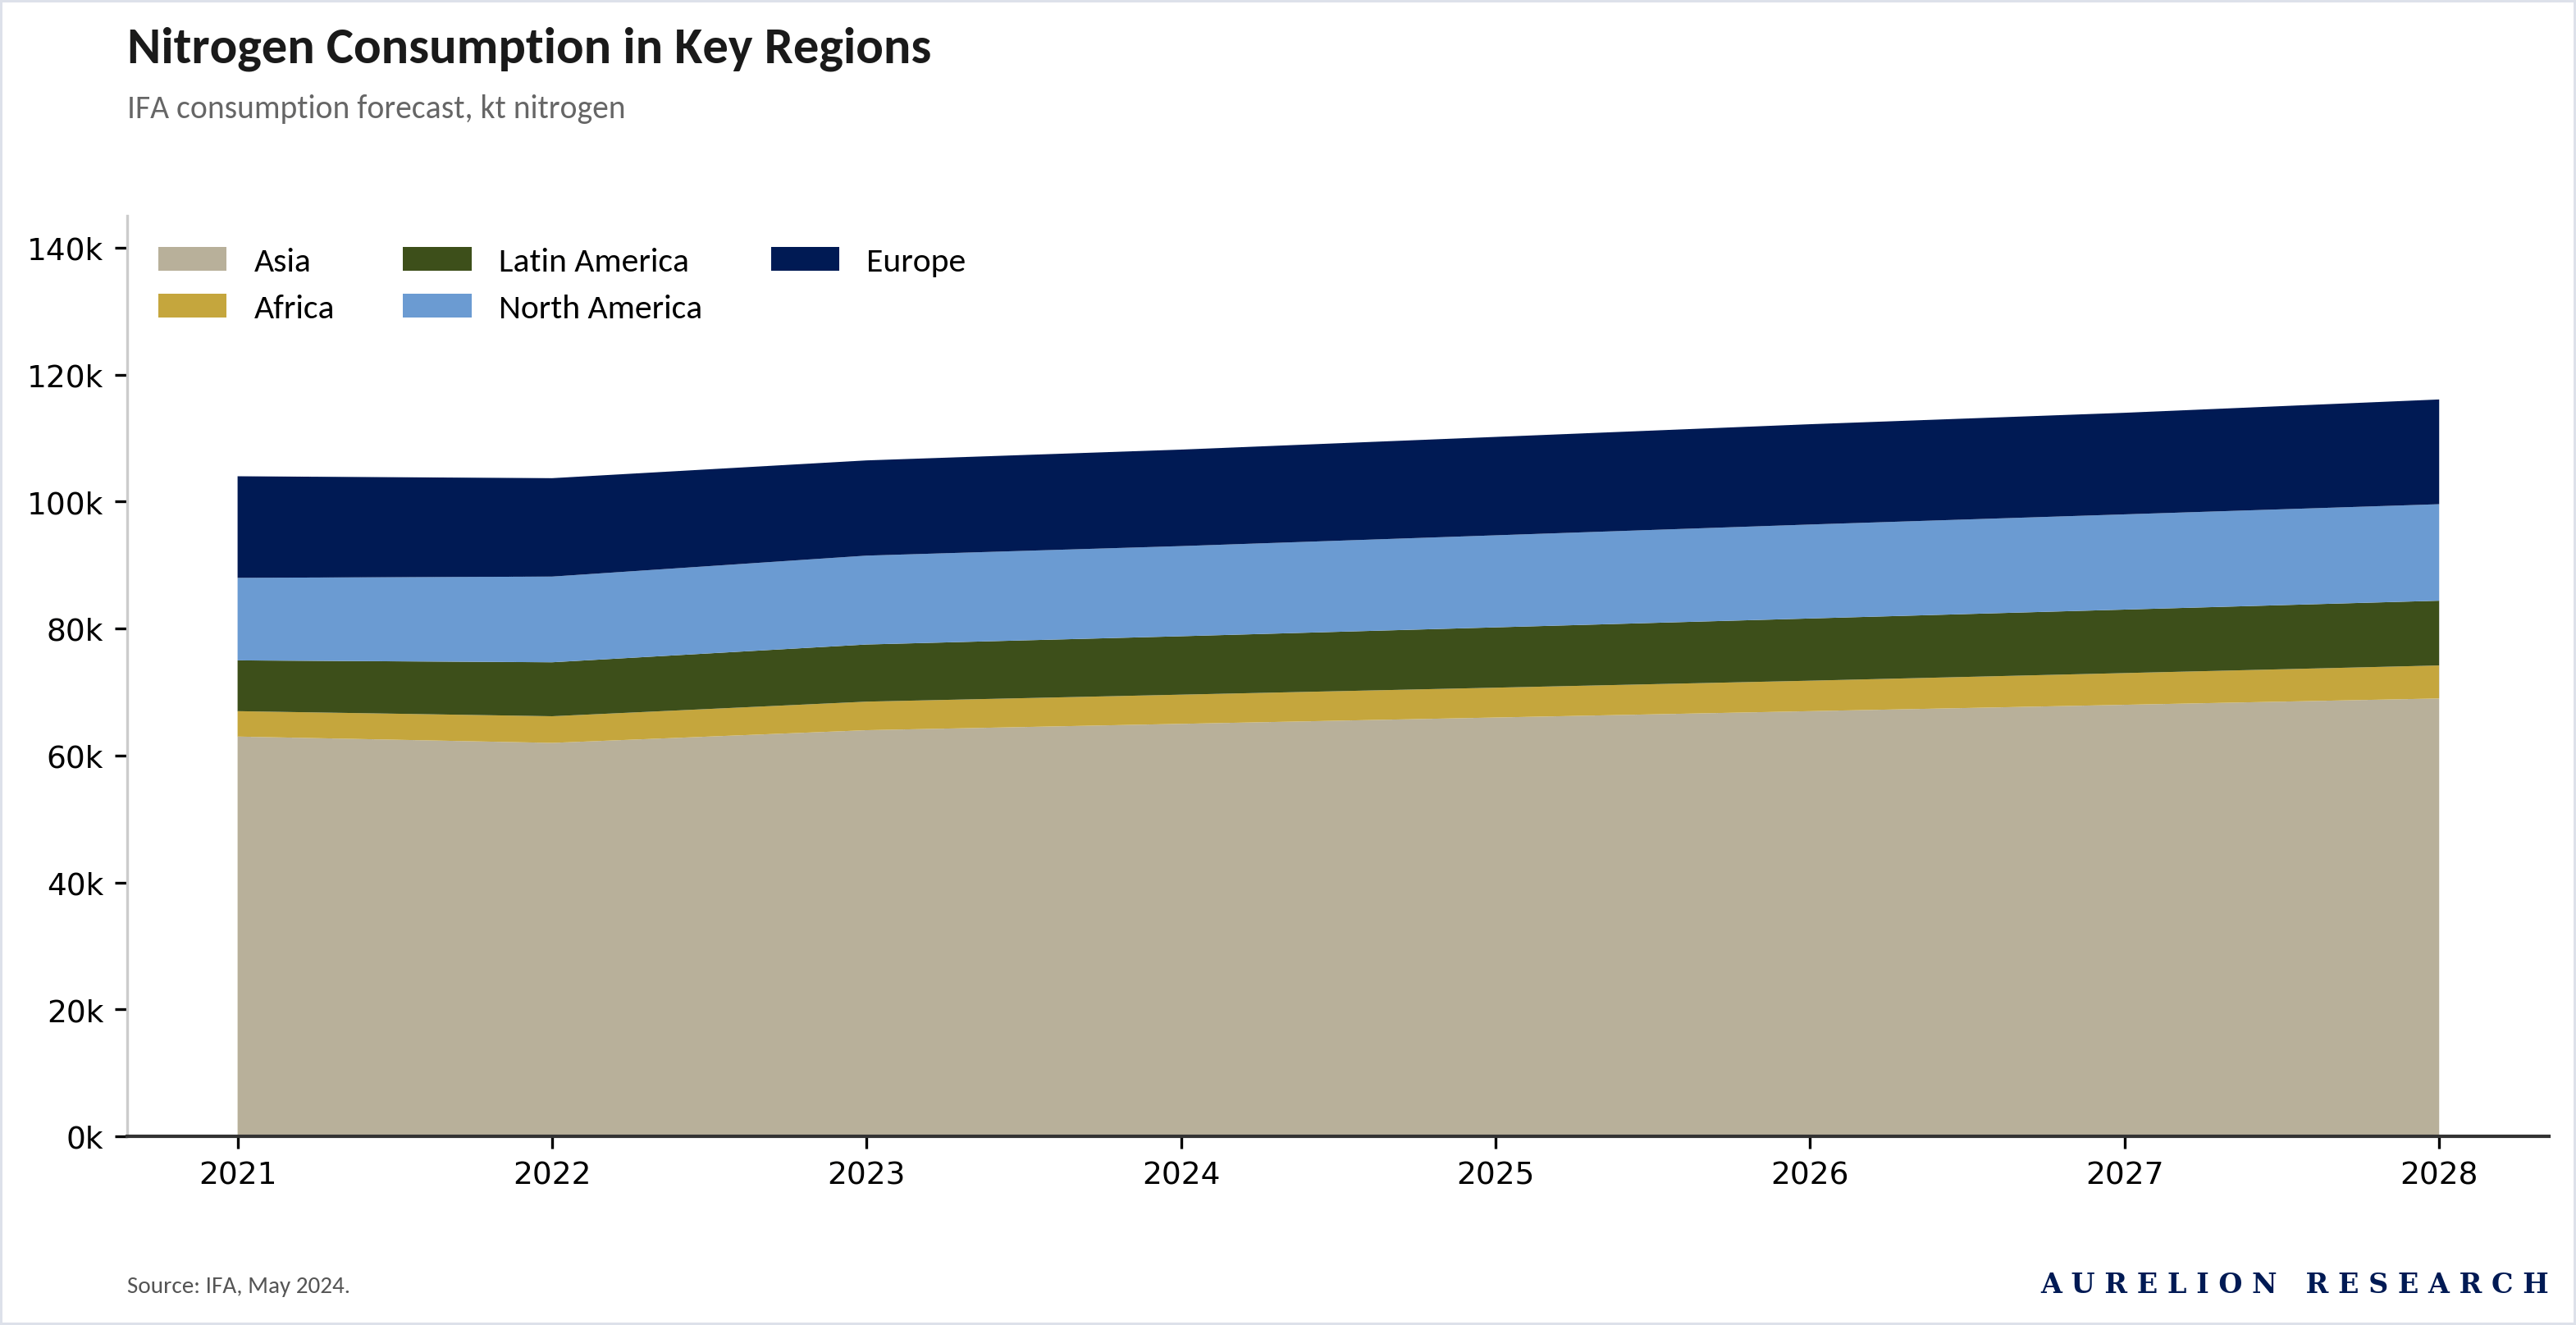
Global consumption is growing slowly but steadily, led by Asia. IFA forecasts total nitrogen consumption rising from around 105M tonnes in 2021 to over 110M tonnes by 2028. Asia accounts for roughly 60% of that total and is the primary growth engine. Europe and North America are essentially flat.
Africa & Latin America are growing, but from a small base. The overall growth rate is modest at around 1-1.5% per year, but in a market this large, even small percentage gains translate into millions of additional tonnes of demand.
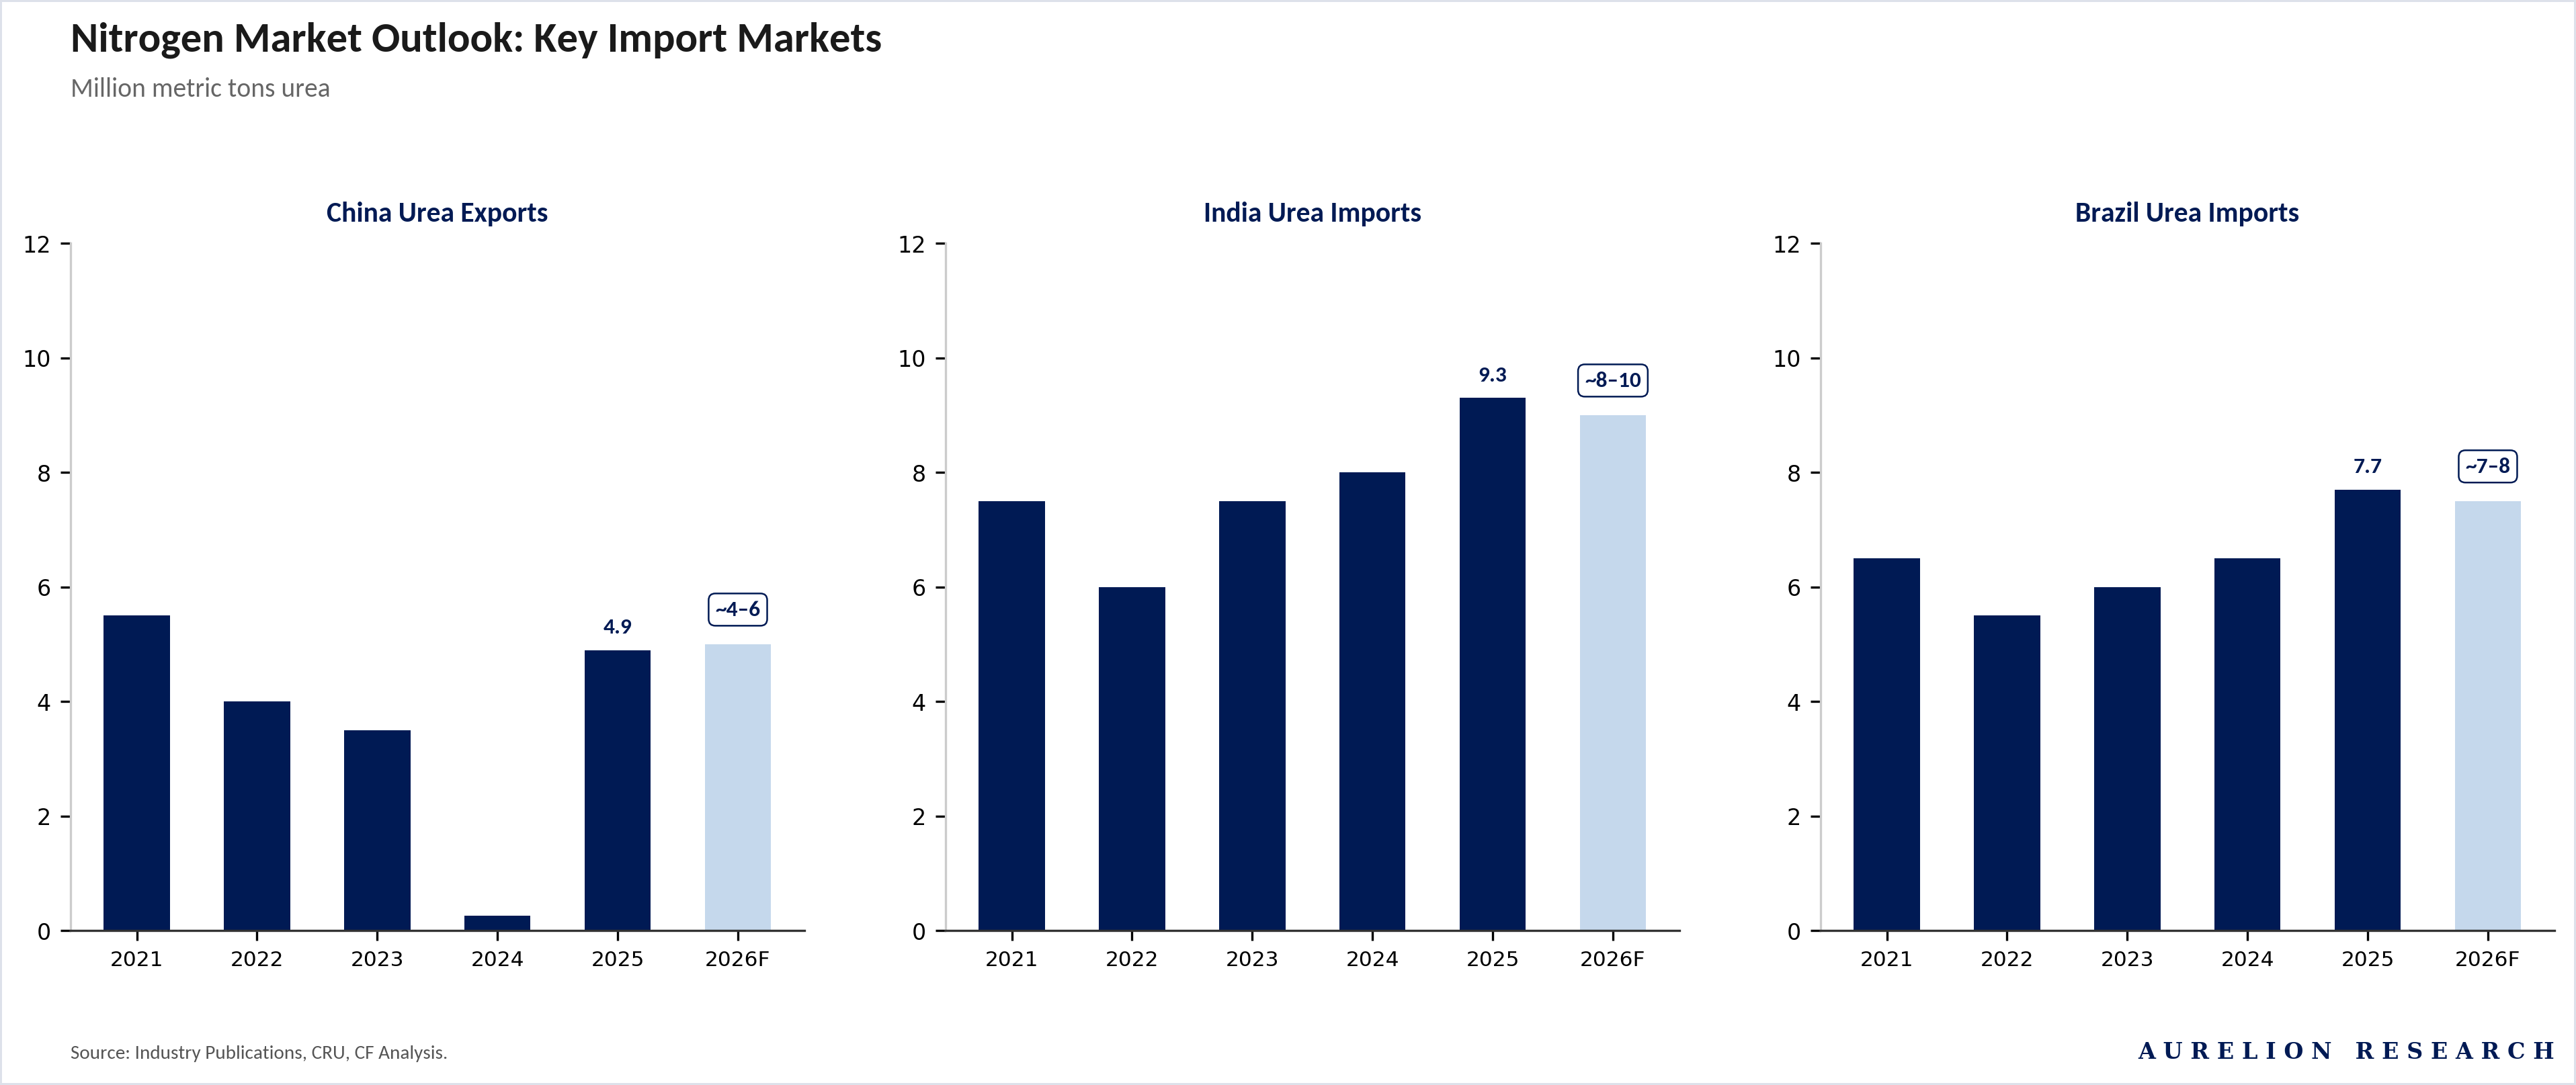
The three import markets to watch are India, Brazil and, surprisingly, China. India imported 9.3M tonnes of urea in 2025, up from 6M tonnes in 2022, and forecasts for 2026 sit in the 8-10M tonne range. But with domestic production now curtailed by gas rationing, the actual import requirement could be higher. Brazil took in 7.7M tonnes in 2025 and is expected to need 7-8M tonnes in 2026, virtually all of which has to come from overseas.
The interesting story is China: after nearly zeroing out urea exports in 2022-23 to protect domestic supply, China ramped back up to 4.9M tonnes in 2025 and was expected to export 4-6M tonnes in 2026. That return to market was supposed to ease the global balance. The sulphur and energy squeeze from the Middle East conflict has put that assumption in serious doubt.
The supply side is where the real tension builds. Outside of China, new urea capacity additions are running well below demand growth. After 4.5M tonnes of new capacity came online in 2023, additions dropped to just 0.7M tonnes in 2024 and 0.3M tonnes in 2025. The pipeline picks up to 2.2M tonnes in 2026 and 3.4M tonnes in 2027, but falls back to 1.0-1.3M tonnes in 2029-30.
Average consumption growth runs at ~2.3M tonnes per year. In 2024, 2025, 2029 and 2030, new capacity falls short of that growth rate, meaning the market needs to draw on spare capacity or Chinese exports to stay balanced. With Chinese exports now uncertain and Persian Gulf supply disrupted, those two sources of flexibility are both compromised at the same time.
The volatility in the capacity addition schedule is worth understanding. Urea plants are large, capital intensive projects that take 3-5 years to build.
They tend to come in waves: a period of high prices triggers investment decisions, which then deliver new capacity several years later, often arriving just as the market has already cooled. That is what the chart shows.
The 4.5M tonnes that came online in 2023 were largely projects sanctioned during the 2021-22 price boom. The near-zero additions in 2024-25 reflect the period before that, when prices were low and nobody was building.
The bump in 2026-28 is the next wave of post-crisis investment, and the drop-off in 2029-30 tells us that the current tightness has not yet triggered enough new project approvals to fill the gap later in the decade. By the time the market realizes it needs more capacity, it will be years before it arrives.
Bottom line on nitrogen. This is the largest, most traded, and most geopolitically exposed fertilizer segment. Prices have already moved sharply higher. The supply picture ex-China is tight, with new capacity additions below demand growth in most years through 2030.
India & Brazil remain heavily import-dependent. And the two swing factors that the market has relied on to stay balanced, Chinese exports and Persian Gulf supply, are both constrained simultaneously. If this persists beyond the next few months, nitrogen prices have room to run well above current levels.
2.3 Phosphate Outlook
Phosphate has the worst supply setup of the three nutrients right now. Four countries control the DAP export market: China, Morocco, Saudi Arabia and Russia. Three of them are constrained. China keeps pulling back exports to protect domestic supply. Saudi shipments are caught up in the Strait of Hormuz disruption. Russia has been operating under sanctions pressure since 2022. That leaves Morocco as the only major exporter running freely, and even Morocco depends on imported sulphur and ammonia to keep its plants going. When your market relies on four suppliers and three of them have problems, prices stay elevated.
The export data makes this very visible. After a decade of gradually rising global DAP trade, volumes have fallen off sharply in 2025. China is the main story. Chinese exports were above 5M tonnes in 2021, dropped to nearly zero in 2023 as the government restricted outflows, recovered partially in 2024-25, and are now at risk again as the sulphur squeeze intensifies.
Every time the market expects China to come back, something pulls it away. That pattern is becoming the defining feature of this market.
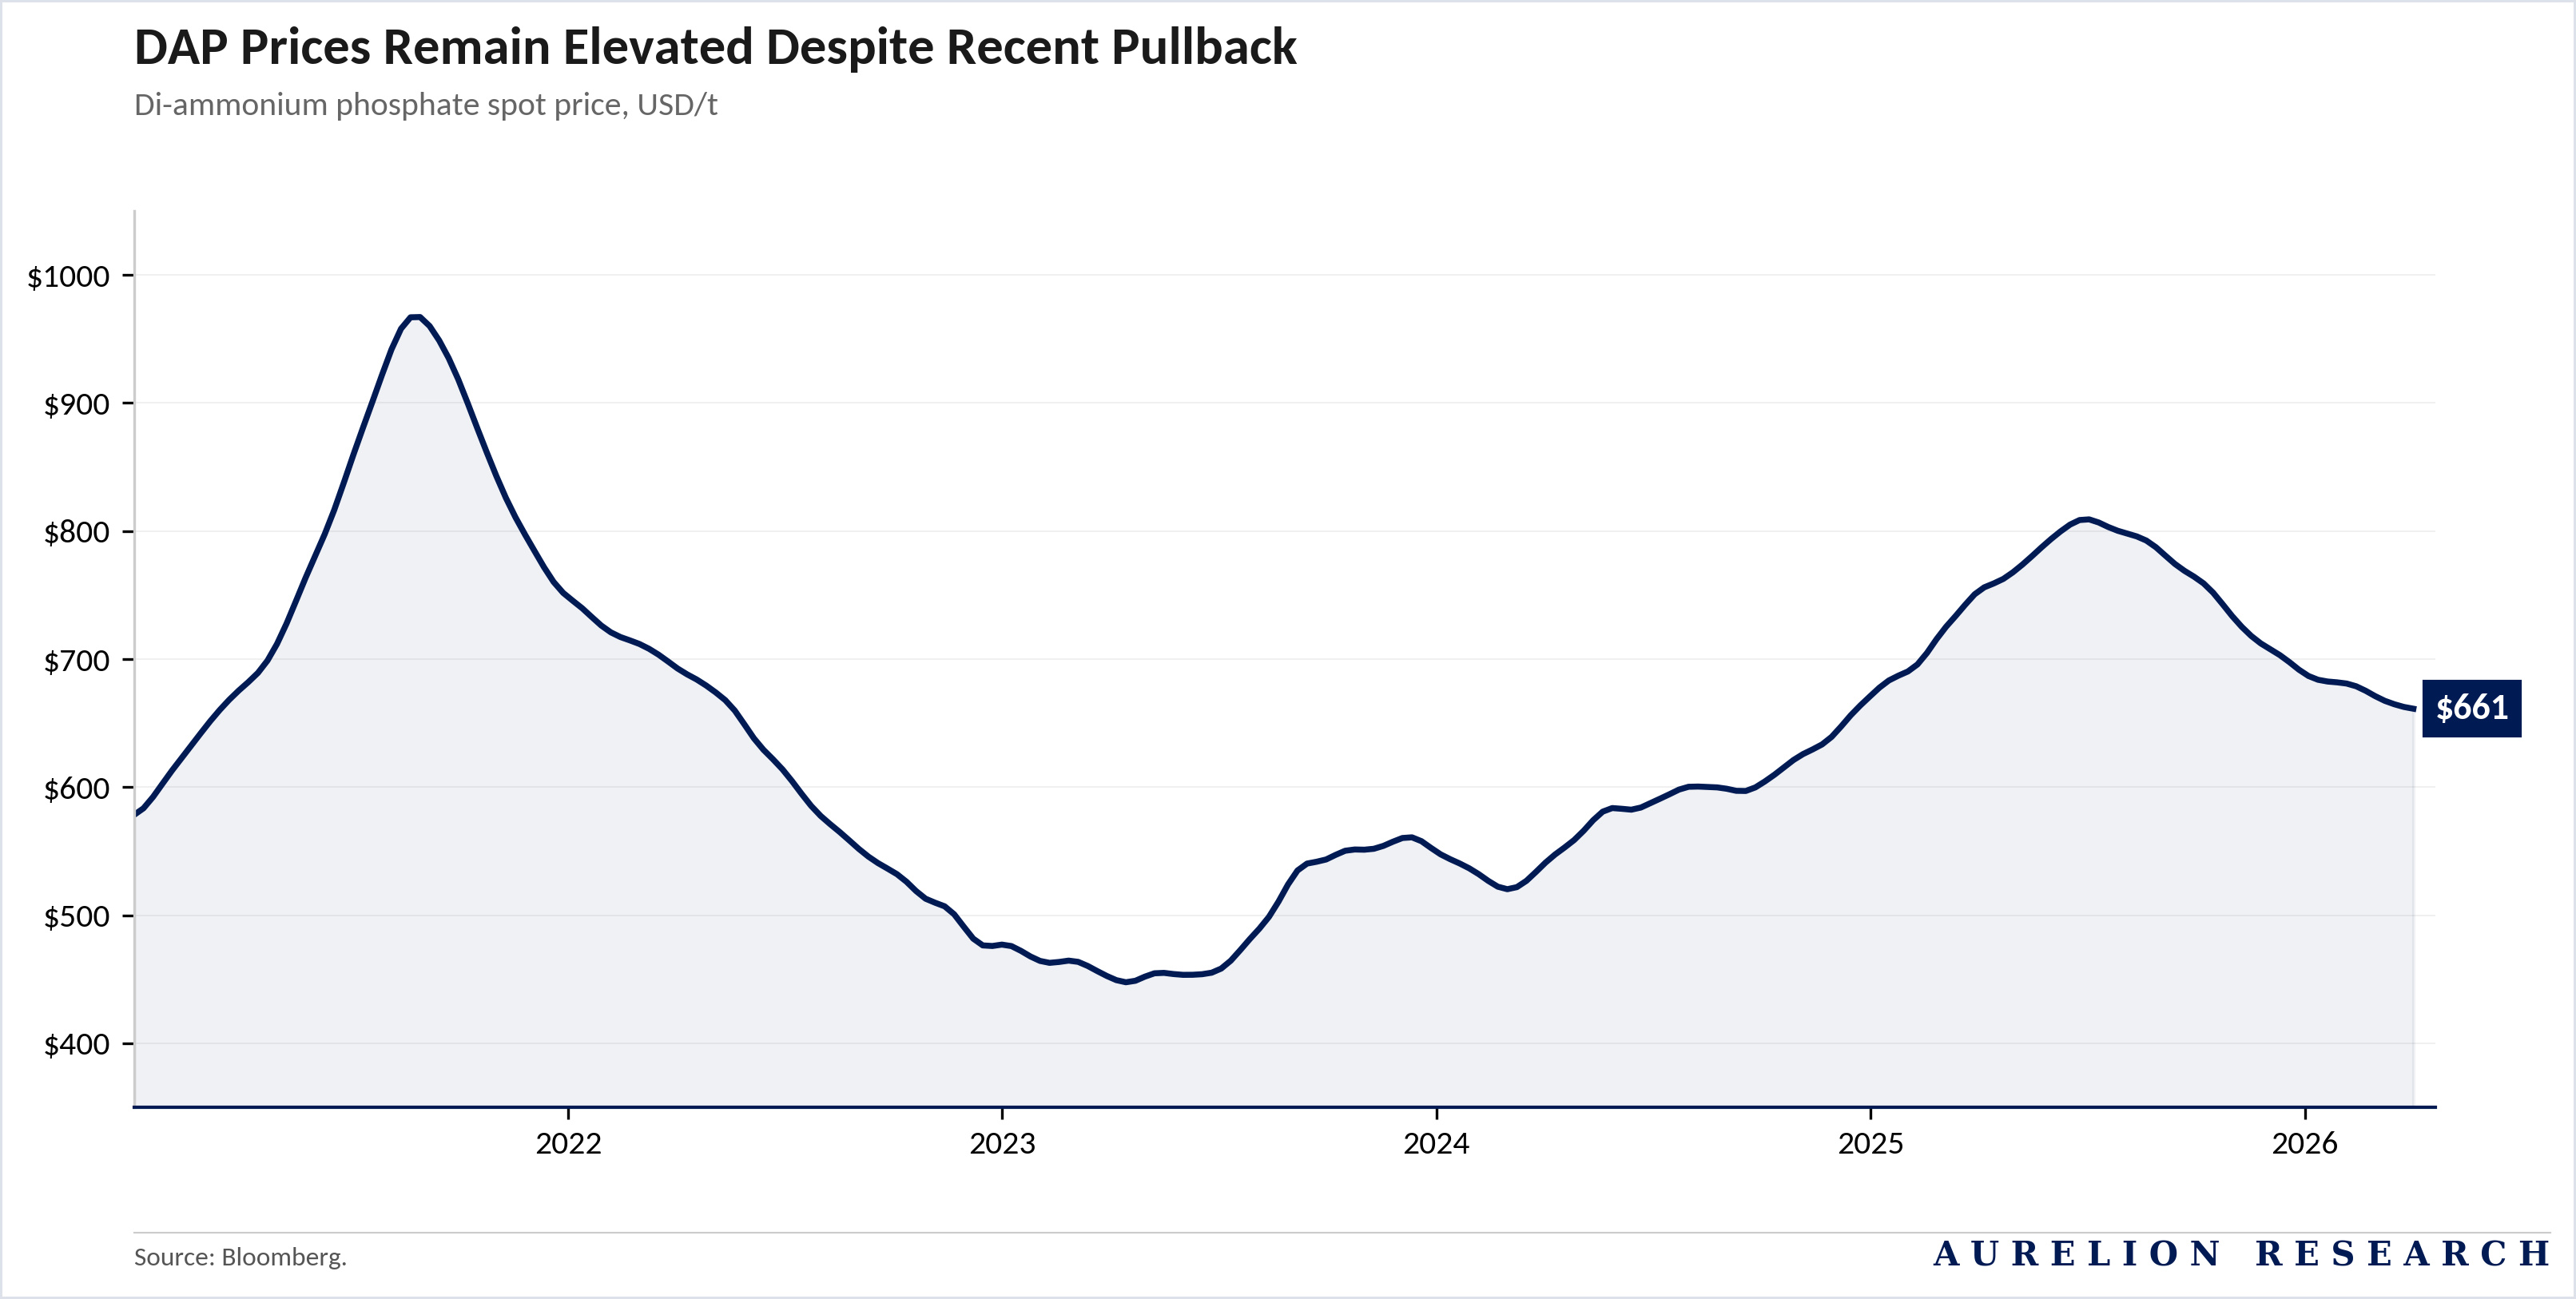
DAP prices have come down from the mid-2025 highs, but the floor keeps moving up. At $661/t, DAP is off its recent peak near $800/t, but still well above where it traded through most of 2023-24. Look at the price chart over the past four years: every spike is followed by a pullback, but each pullback settles higher than the one before. The $400/t floor of 2023 became $550 in 2024, and now $650 looks like the new base. This is a market where the tight supply-demand balance is real and is gradually being reflected in prices.
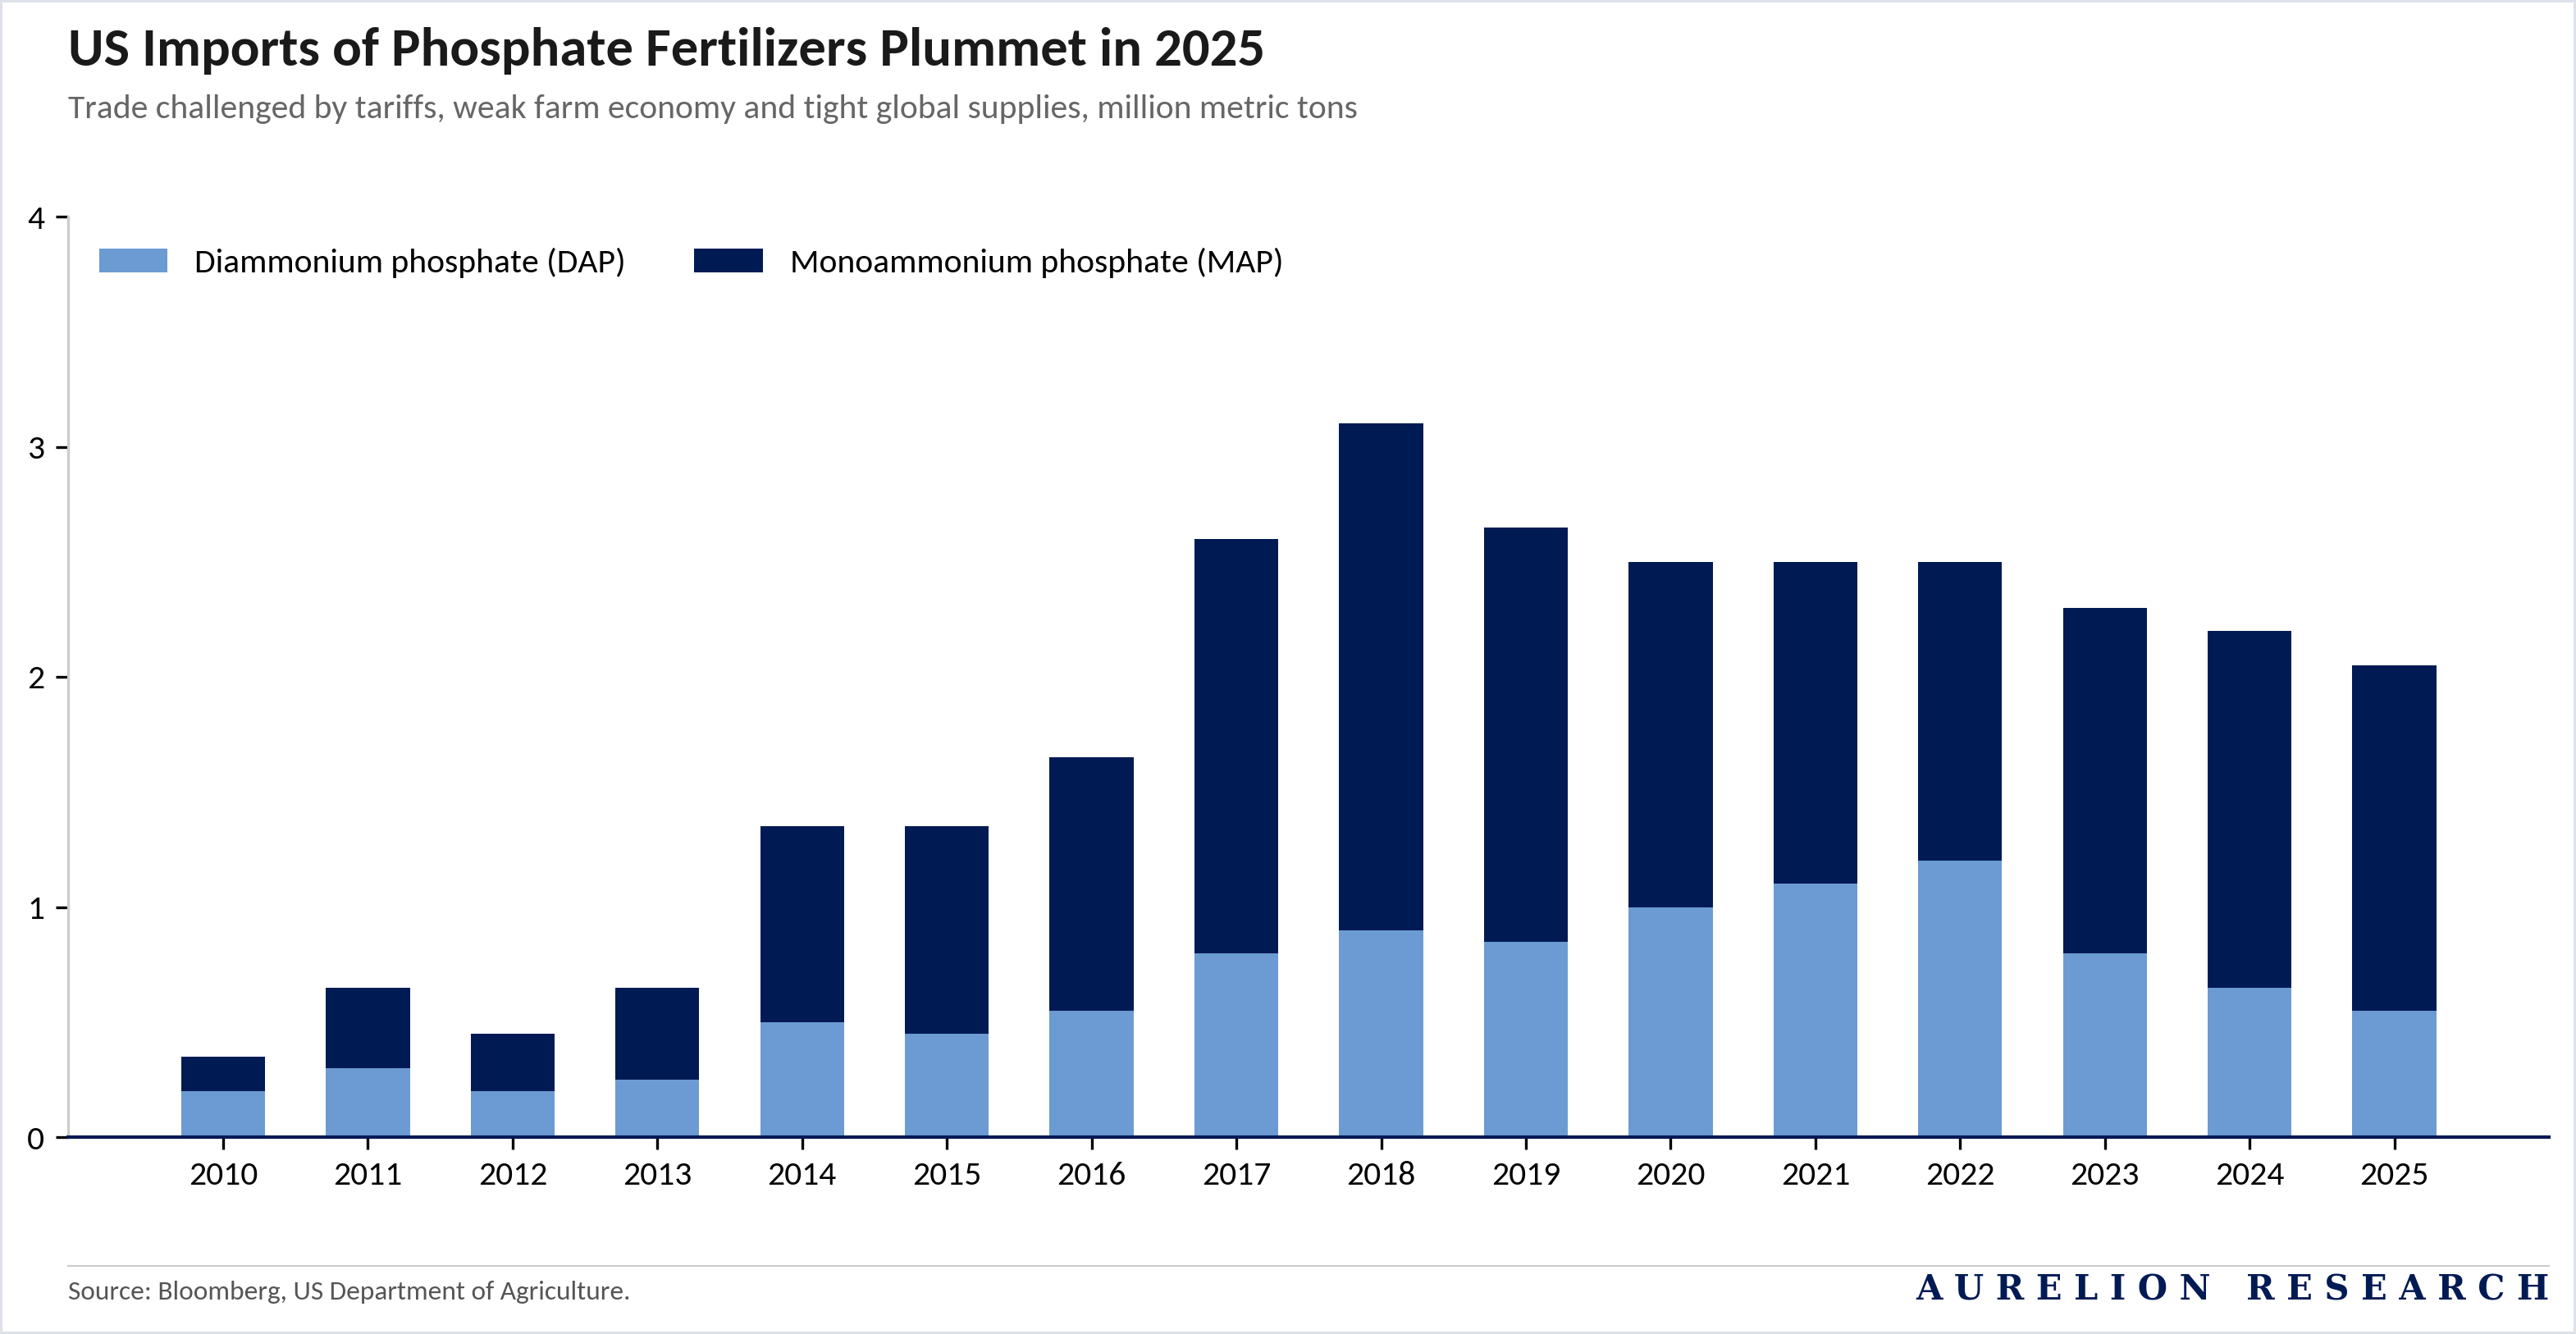
The US is a good example of what happens when supply tightens. American phosphate imports peaked above 3M tonnes in 2018 and have been falling steadily since, reaching roughly 2M tonnes in 2025. Tariffs, a tough farm economy and shrinking global availability have all played a role. This leaves US farmers with less imported supply heading into each planting season.
The March letter from 64 agricultural groups urging Mosaic & JR Simplot, two of the largest US phosphate fertilizer producers, to drop support for duties on Moroccan phosphate imports tells you where the pressure is being felt: buyers are running out of options and want every available trade route open.
Demand keeps growing, and the supply side cannot keep up.
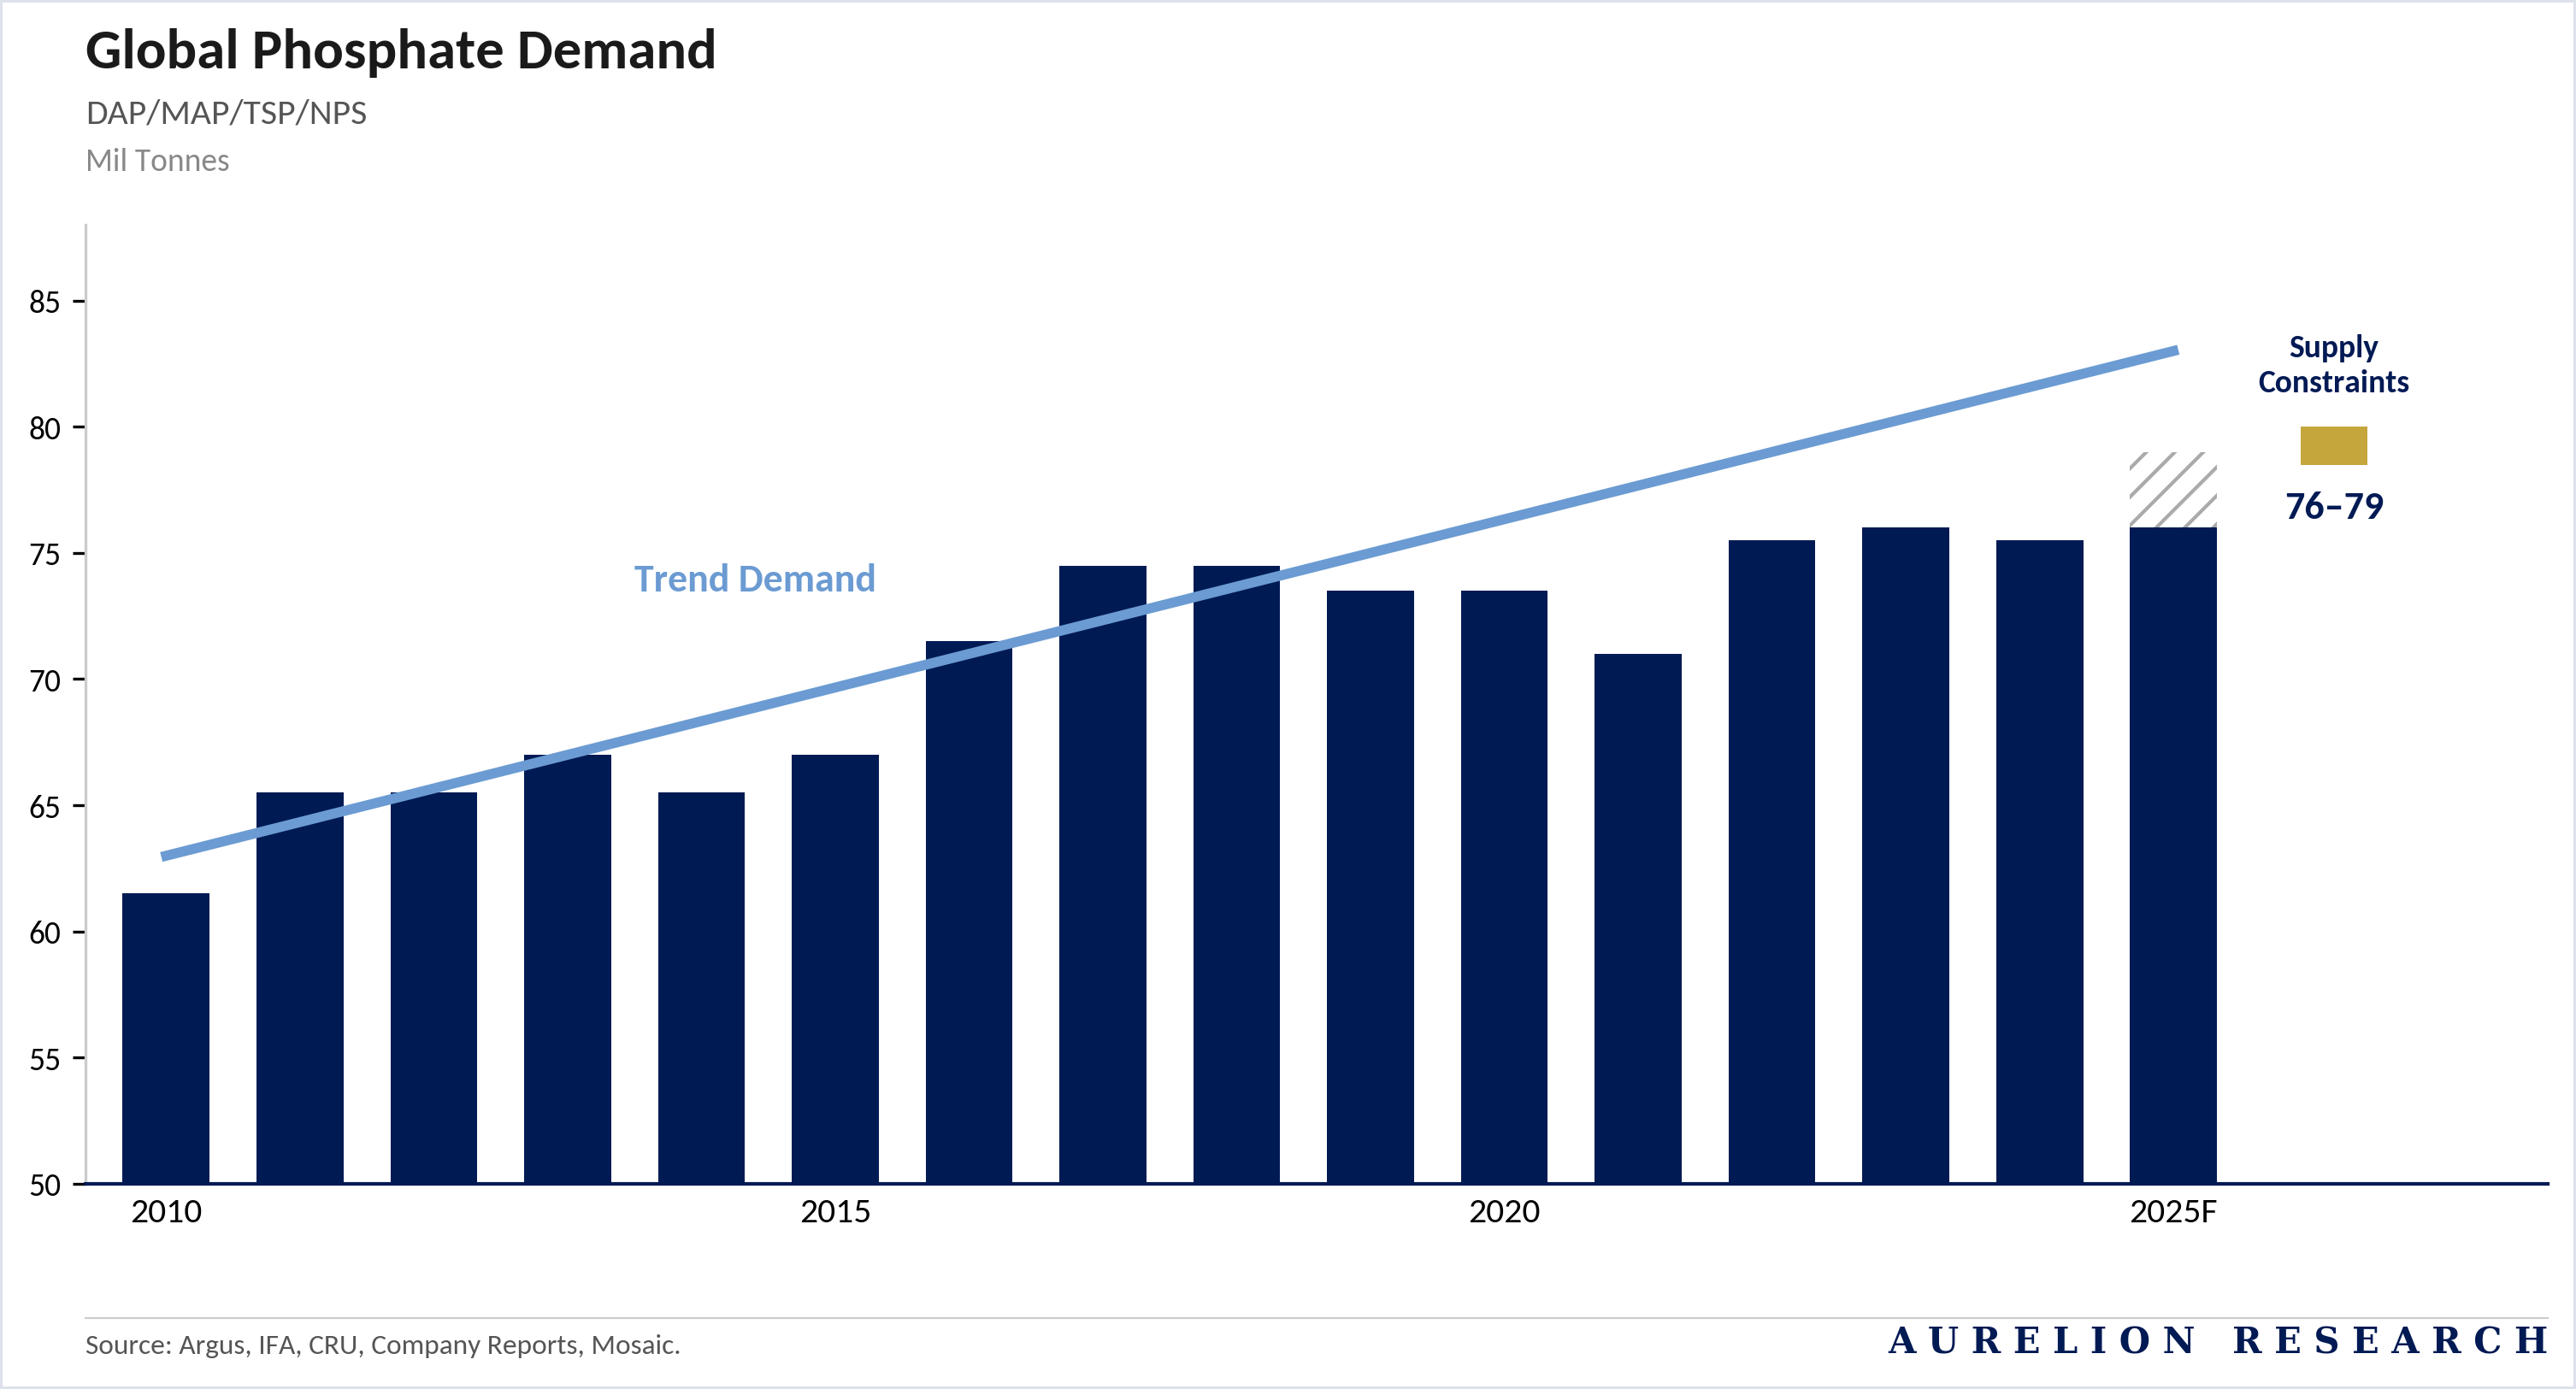
Global phosphate consumption has risen steadily from around 62M tonnes in 2010 to an estimated 76-79M tonnes in 2025, tracking the long-term trend line closely. But the gap between where demand is heading and what the supply chain can deliver is starting to widen. Phosphate rock deposits are concentrated in a handful of countries, new mines take years to permit and build, and the entire processing chain from rock to finished fertilizer requires sulphur and ammonia at every step. When those inputs are disrupted, as they are now, the whole chain slows down. And unlike nitrogen, where at least some new capacity is being built, the phosphate pipeline has been quiet.
Bottom line on phosphate. This is the tightest of the three nutrient markets. The major exporters are all dealing with some form of restriction or disruption. Prices have pulled back from peak levels but the floor keeps rising. US imports are declining when farmers need them most. And global demand continues to grow with very little new capacity coming online.
The single biggest variable is China. If Chinese exports come back at scale later in 2026, the market gets some relief. If they do not, the tightness we see today could easily last into 2027 and beyond.
3. Who Are the Big Players?
A Look at the Global Fertilizer Leaders
3.1 Nutrien
3.2 Mosaic Company
3.3 Yara