
Global Chemicals Primer 2026: Navigating the Year of Uncertainty
This aims to be the most complete piece possible on the sector, and a playbook for how we plan to approach the turnaround we expect in chemicals.

The chemical sector is having a strong run, well ahead of the broader market. What makes it unusual is that stocks are climbing even as earnings estimates for the next few years have been revised lower. The names driving the move are tied to electronics and semiconductors, where demand remains strong, and companies benefiting from tighter supply conditions.
Defensive names and those with heavy exposure to housing and construction have been left behind. The market is paying up for visible growth and has little patience for stories that need a broad economic recovery to work.
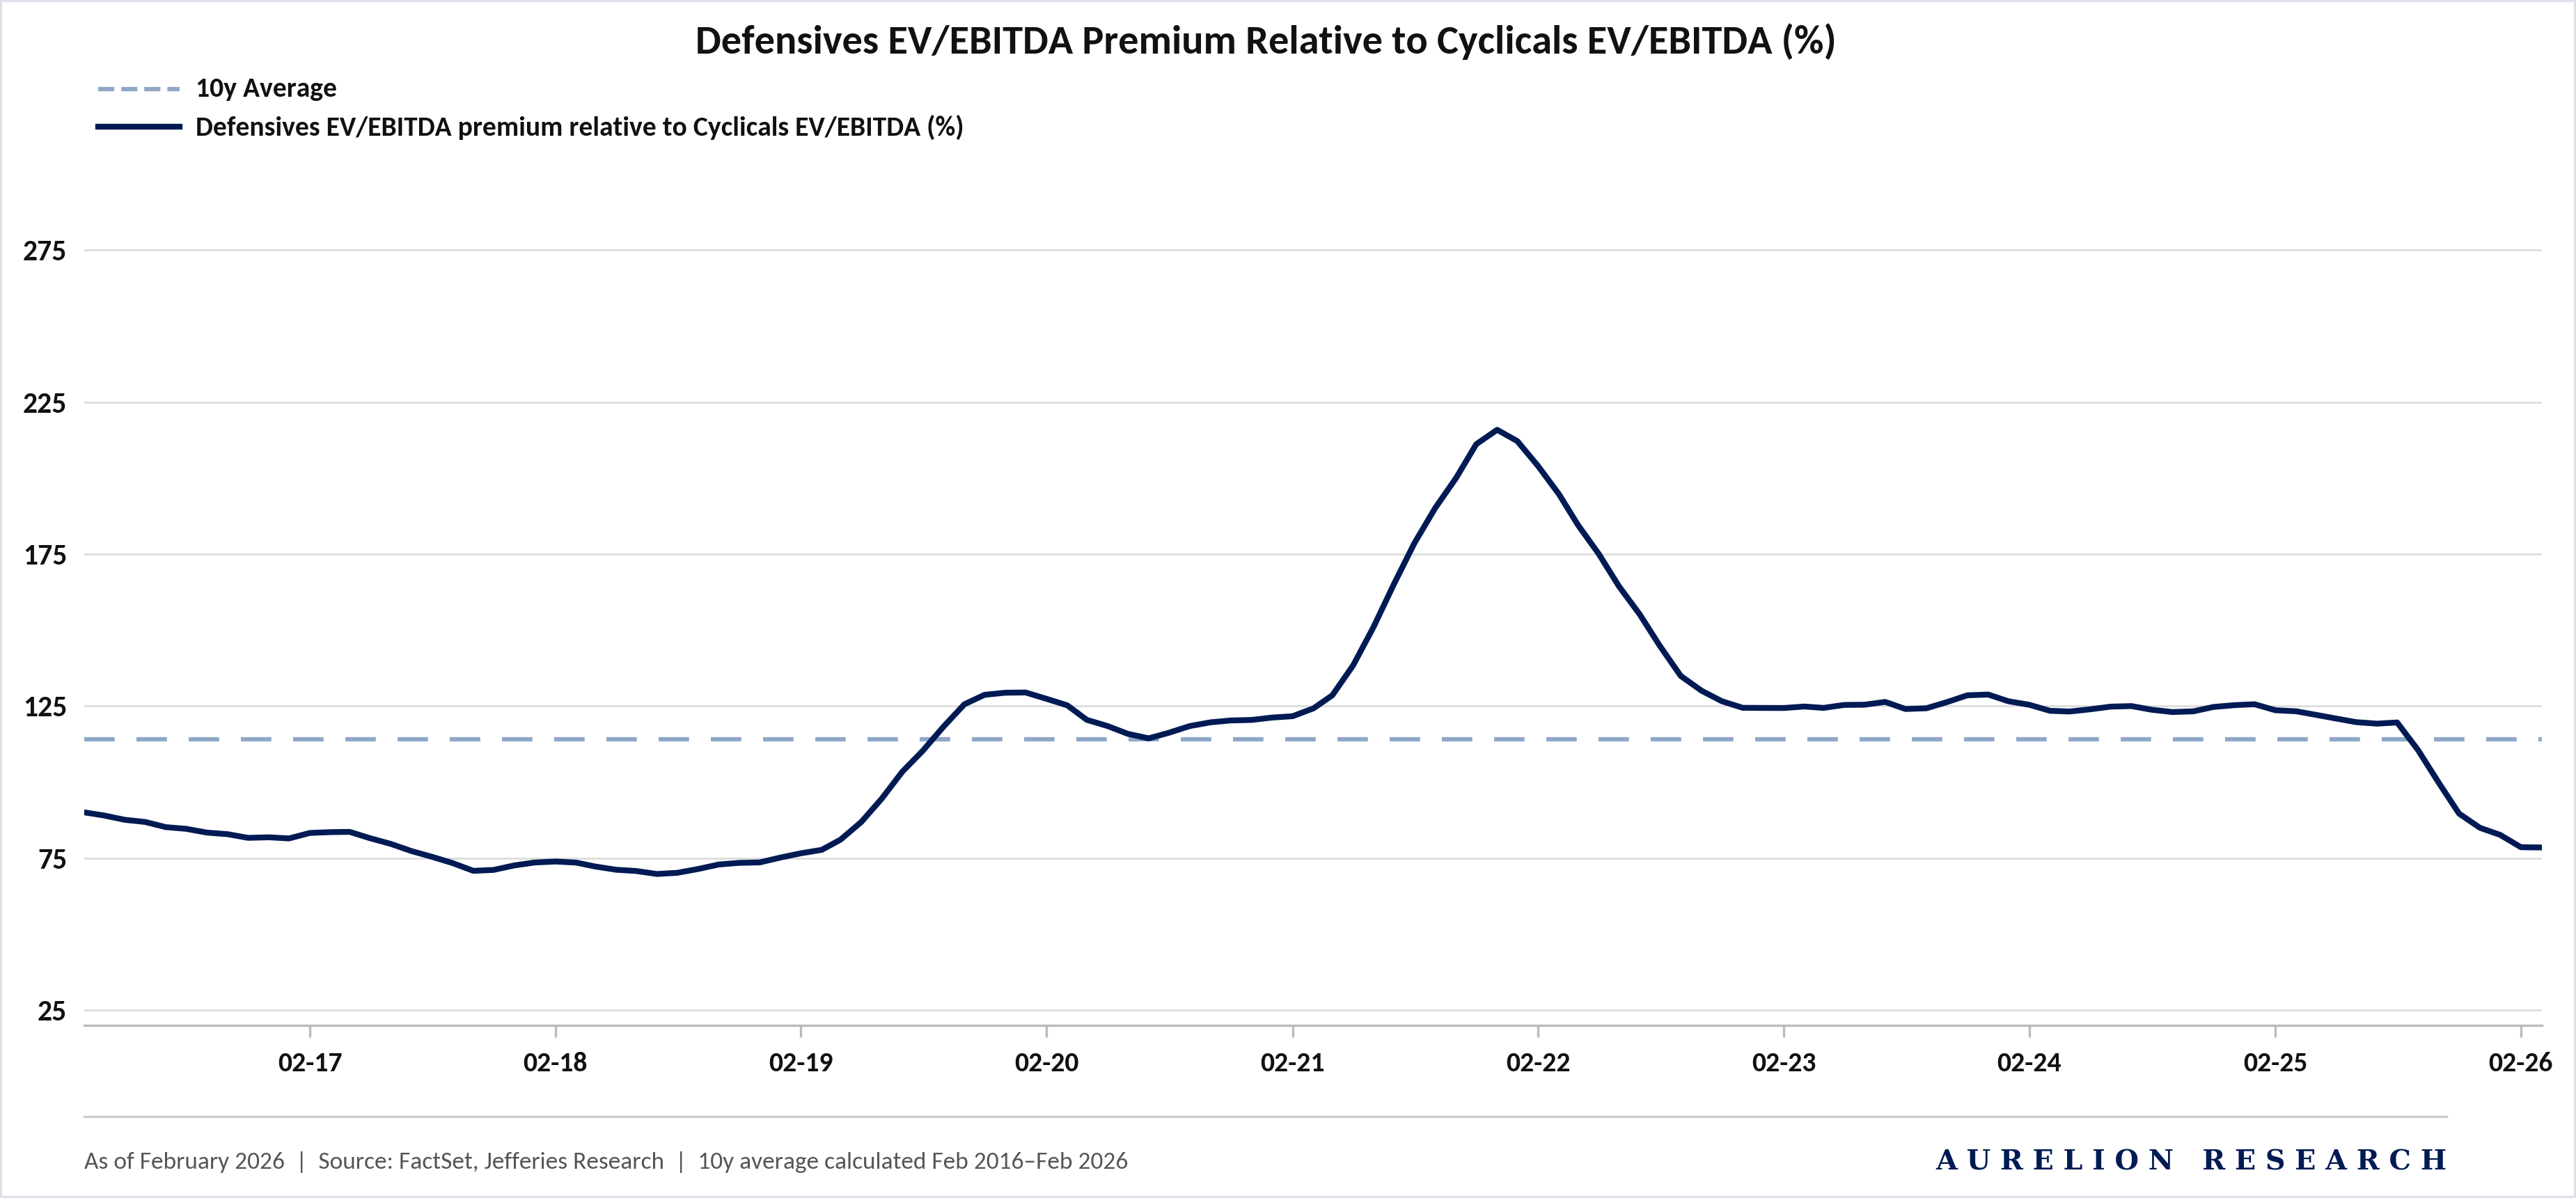
The chart above shows that the defensives premium over cyclicals has fallen back below its 10-year average and is now near the lower end of its pre-2020 range. Cyclicals may look cheap, but the key question is whether the earnings recovery is strong enough to support that re-rating.
Table of Contents
Chemical Markets Overview
Middle East Capacity Exposure
Global Chemicals as an Industrial Leading Indicator
Breaking Down the Chemical Stocks One by One: DOW, LYB, HUN & BAK
Polyethylene: A Major Catalyst for US Producers
Ethylene & Propylene: Tighter Supply & Rising Costs
Industry Developments
Several industry players also made strategic moves or received regulatory updates recently. In the energy sector, a major producer is increasing its capacity to meet rising demand for nuclear fuel components and is working closely with the government on future expansions. Regarding environmental milestones, an eco-friendly polymer recently received approval for use in agriculture, which should pave the way for its commercial launch.
In corporate news, one firm resolved a significant pricing dispute through a legal settlement, while an investment group substantially increased its ownership stake in a major coatings manufacturer. Finally, projections for the auto industry have been adjusted, with expectations rising for North American production while cooling slightly for the market in China.
1. Chemical Markets: The Potential Fallout
With conflict escalating in Iran and across the broader Middle East, several key chemical markets are facing meaningful supply risk. If disruption in the Persian Gulf persists and oil prices remain elevated, a select group of U.S. chemical producers could emerge as major beneficiaries.
That group includes Dow, LyondellBasell, Olin, Westlake, and Celanese. Higher oil prices raise production costs for competitors in Europe and Asia, which widens the cost advantage for U.S. producers.
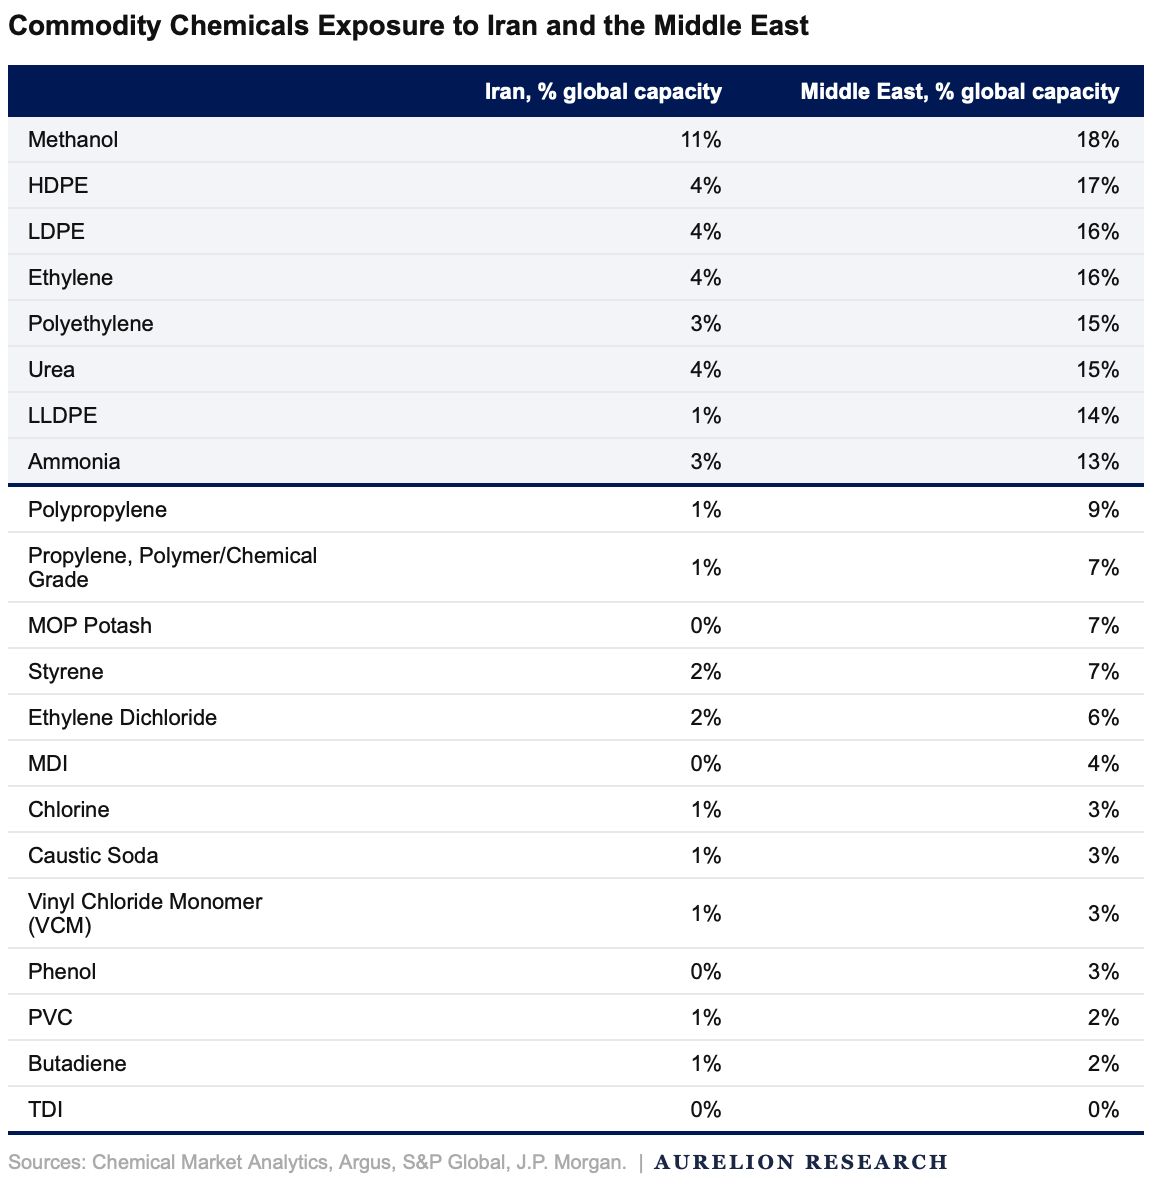
The Methanol Factor
Iran plays a significant role in global chemicals, particularly in methanol. The country is the world’s second largest producer, accounting for roughly 11% of global capacity. Domestic consumption remains limited, which means more than 90% of output is exported, mainly to China and India.
China is especially exposed. The country imports roughly one quarter of its methanol needs, and more than half of those imports originate from Iran. That methanol feeds Methanol to Olefins facilities, which convert it into plastics such as polyethylene and polypropylene.
Those Chinese plants are already operating under pressure, with margins still weak. Any disruption to Iranian supply would likely force further production cuts. We believe the result would be tighter global plastics availability and upward pressure on prices across the chain.
2. Middle East Capacity Exposure
The Middle East accounts for a meaningful share of global petrochemical capacity. Around 15% of global polyethylene and ethylene capacity is located in the region, and roughly 9% sits inside the Strait of Hormuz. That leaves a large volume of supply exposed to any disruption in the area.
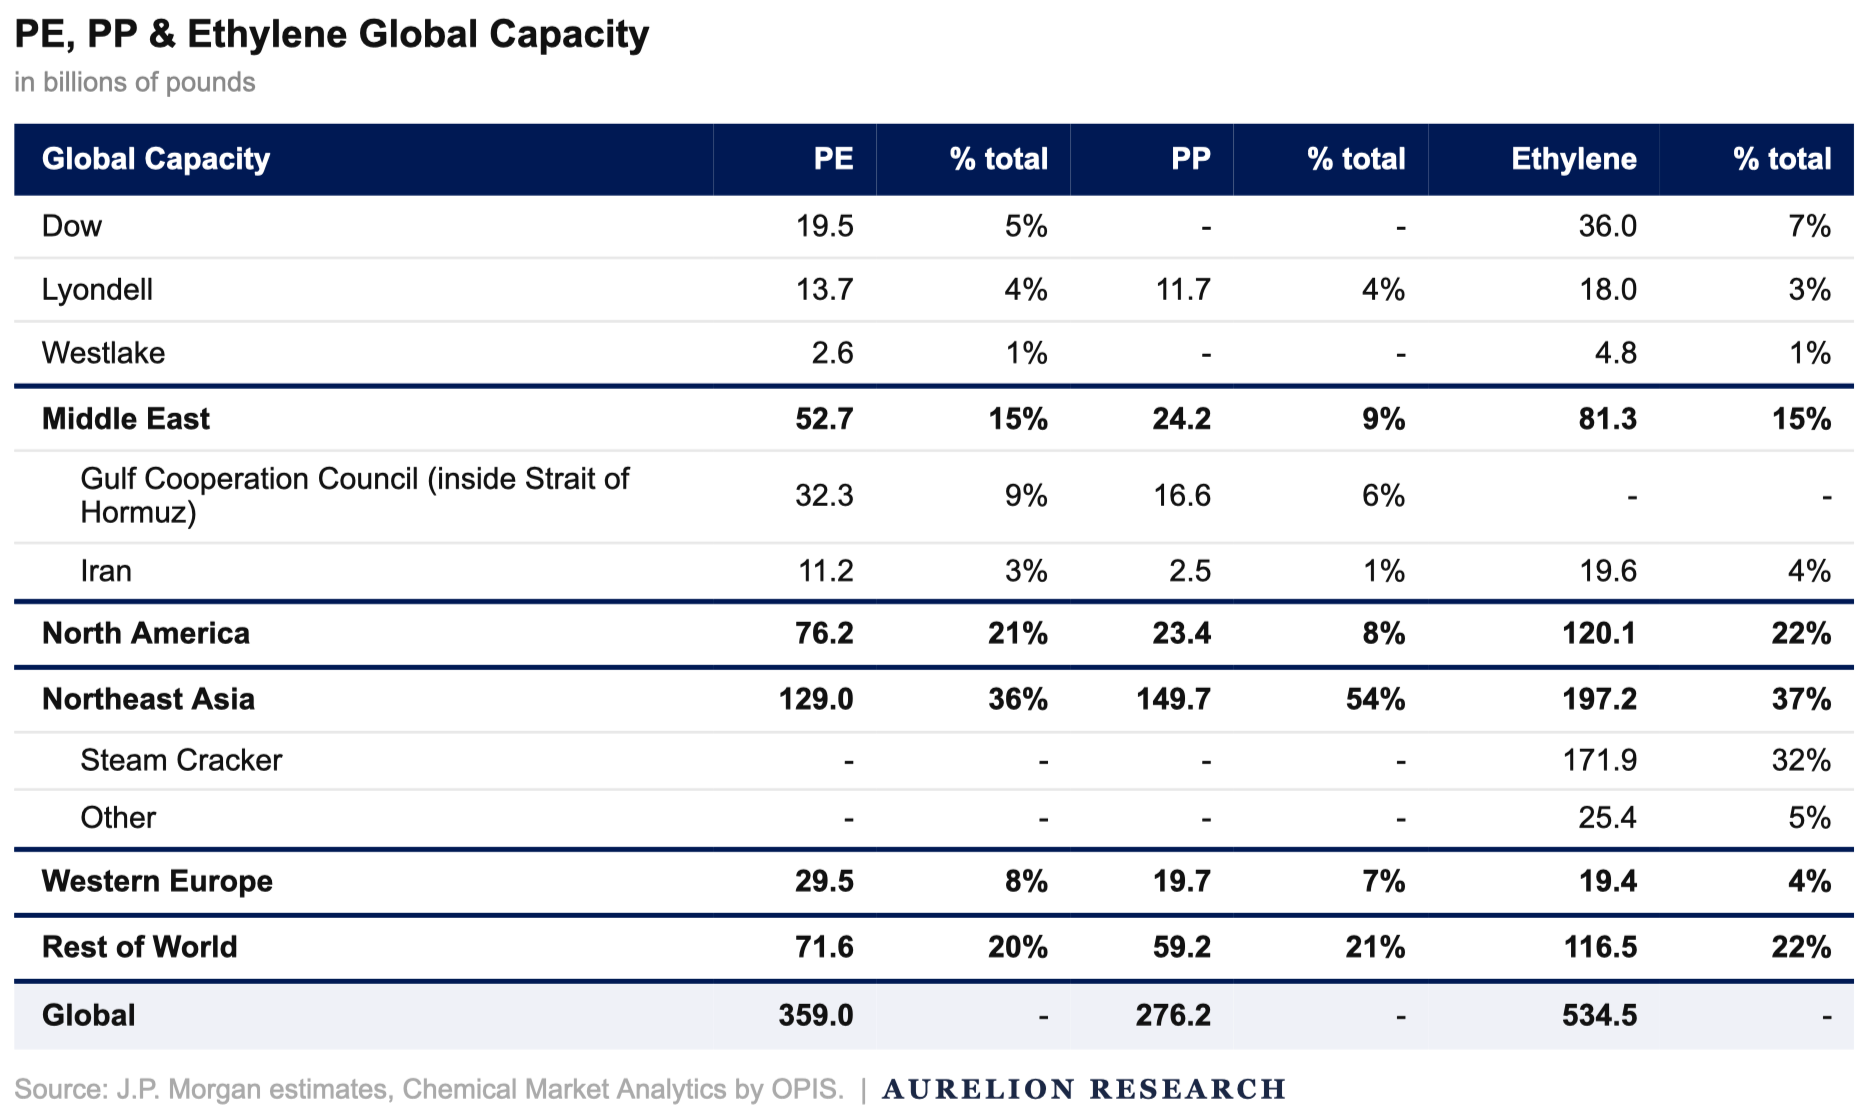
The concentration is important. The Gulf Cooperation Council represents ~9% of global polyethylene capacity and 6% of polypropylene capacity, while Iran adds another 3% of polyethylene supply and ~4% of ethylene capacity.
On their own, those shares may not look that large, but with so much capacity concentrated in one region, the risk to global markets rises. Feedstocks also add to the exposure. More than 37% of global seaborne naphtha passes through the Strait of Hormuz, mostly toward Asia. Since naphtha is a key input for steam crackers, any disruption would quickly raise costs and reduce flexibility for Asian producers.
If those flows are interrupted, the pressure would extend beyond direct production losses. Even assuming imported naphtha is redirected toward ethylene production, around 6% of global ethylene capacity could still face constraints. That does not include added pressure from crude imports used to make naphtha or LPG supplies for mixed feed crackers.
Altogether, the region holds an important position in both petrochemical production and feedstock trade. A prolonged disruption in the Strait of Hormuz would likely tighten supply, raise costs, and make the global chemical chain more difficult to balance.
3. Global Chemicals as an Industrial Leading Indicator
We close with Europe. Industrial chemicals are predominantly a European story, and right now, that story is not getting the attention it deserves.
Think about how the industrial chain actually works. Before a car gets assembled, before a house gets built, before a package gets shipped, someone has to order the chemical inputs first. That sequencing is exactly what makes this sector one of the best early reads on economic activity you can find. When chemical demand picks up, manufacturing follows. When orders soften, the weakness shows up here before it appears almost anywhere else, well before GDP prints or PMI surveys catch it.
The end market exposure makes that signal even more powerful. Chemical volumes touch housing, packaging, autos, appliances, and a huge share of everyday manufactured goods. A move in volumes tells you whether factories are rebuilding inventories, whether construction is gaining momentum, or whether downstream customers are still sitting on their hands. There is a lot of information packed into that number.
The cost side adds another layer that most people overlook. Chemical plants run on high fixed costs, so when utilization swings, it hits profitability hard and fast. Volumes rise, assets run harder, margins expand quickly. Volumes fall, earnings weaken just as fast. That operating leverage is why the sector tends to move sharply at cycle turns in both directions.
Miss the inflection and you miss most of the move.
Chemicals Sector Cost Structure Breakdown
Petrochemicals: Why Europe Runs This Market
The diagram below shows exactly how deep chemical inputs run into the economy. Natural Gas and Crude Oil feed into a Steam Cracker, which produces the core intermediates: Ethylene, Propylene, Butadiene, Aromatics, Ammonia, and Methanol. From there, the chain fans out into hundreds of end products touching nearly every corner of the economy.
Europe dominates this space because the industry was built there over decades, with dense clusters of integrated plants, deep engineering expertise, and long-standing trade relationships with both feedstock suppliers and downstream manufacturers. That history is not easy to replicate, and it is why European producers still set the tone for global chemical markets today.
Petrochemical Supply Chain Diagram
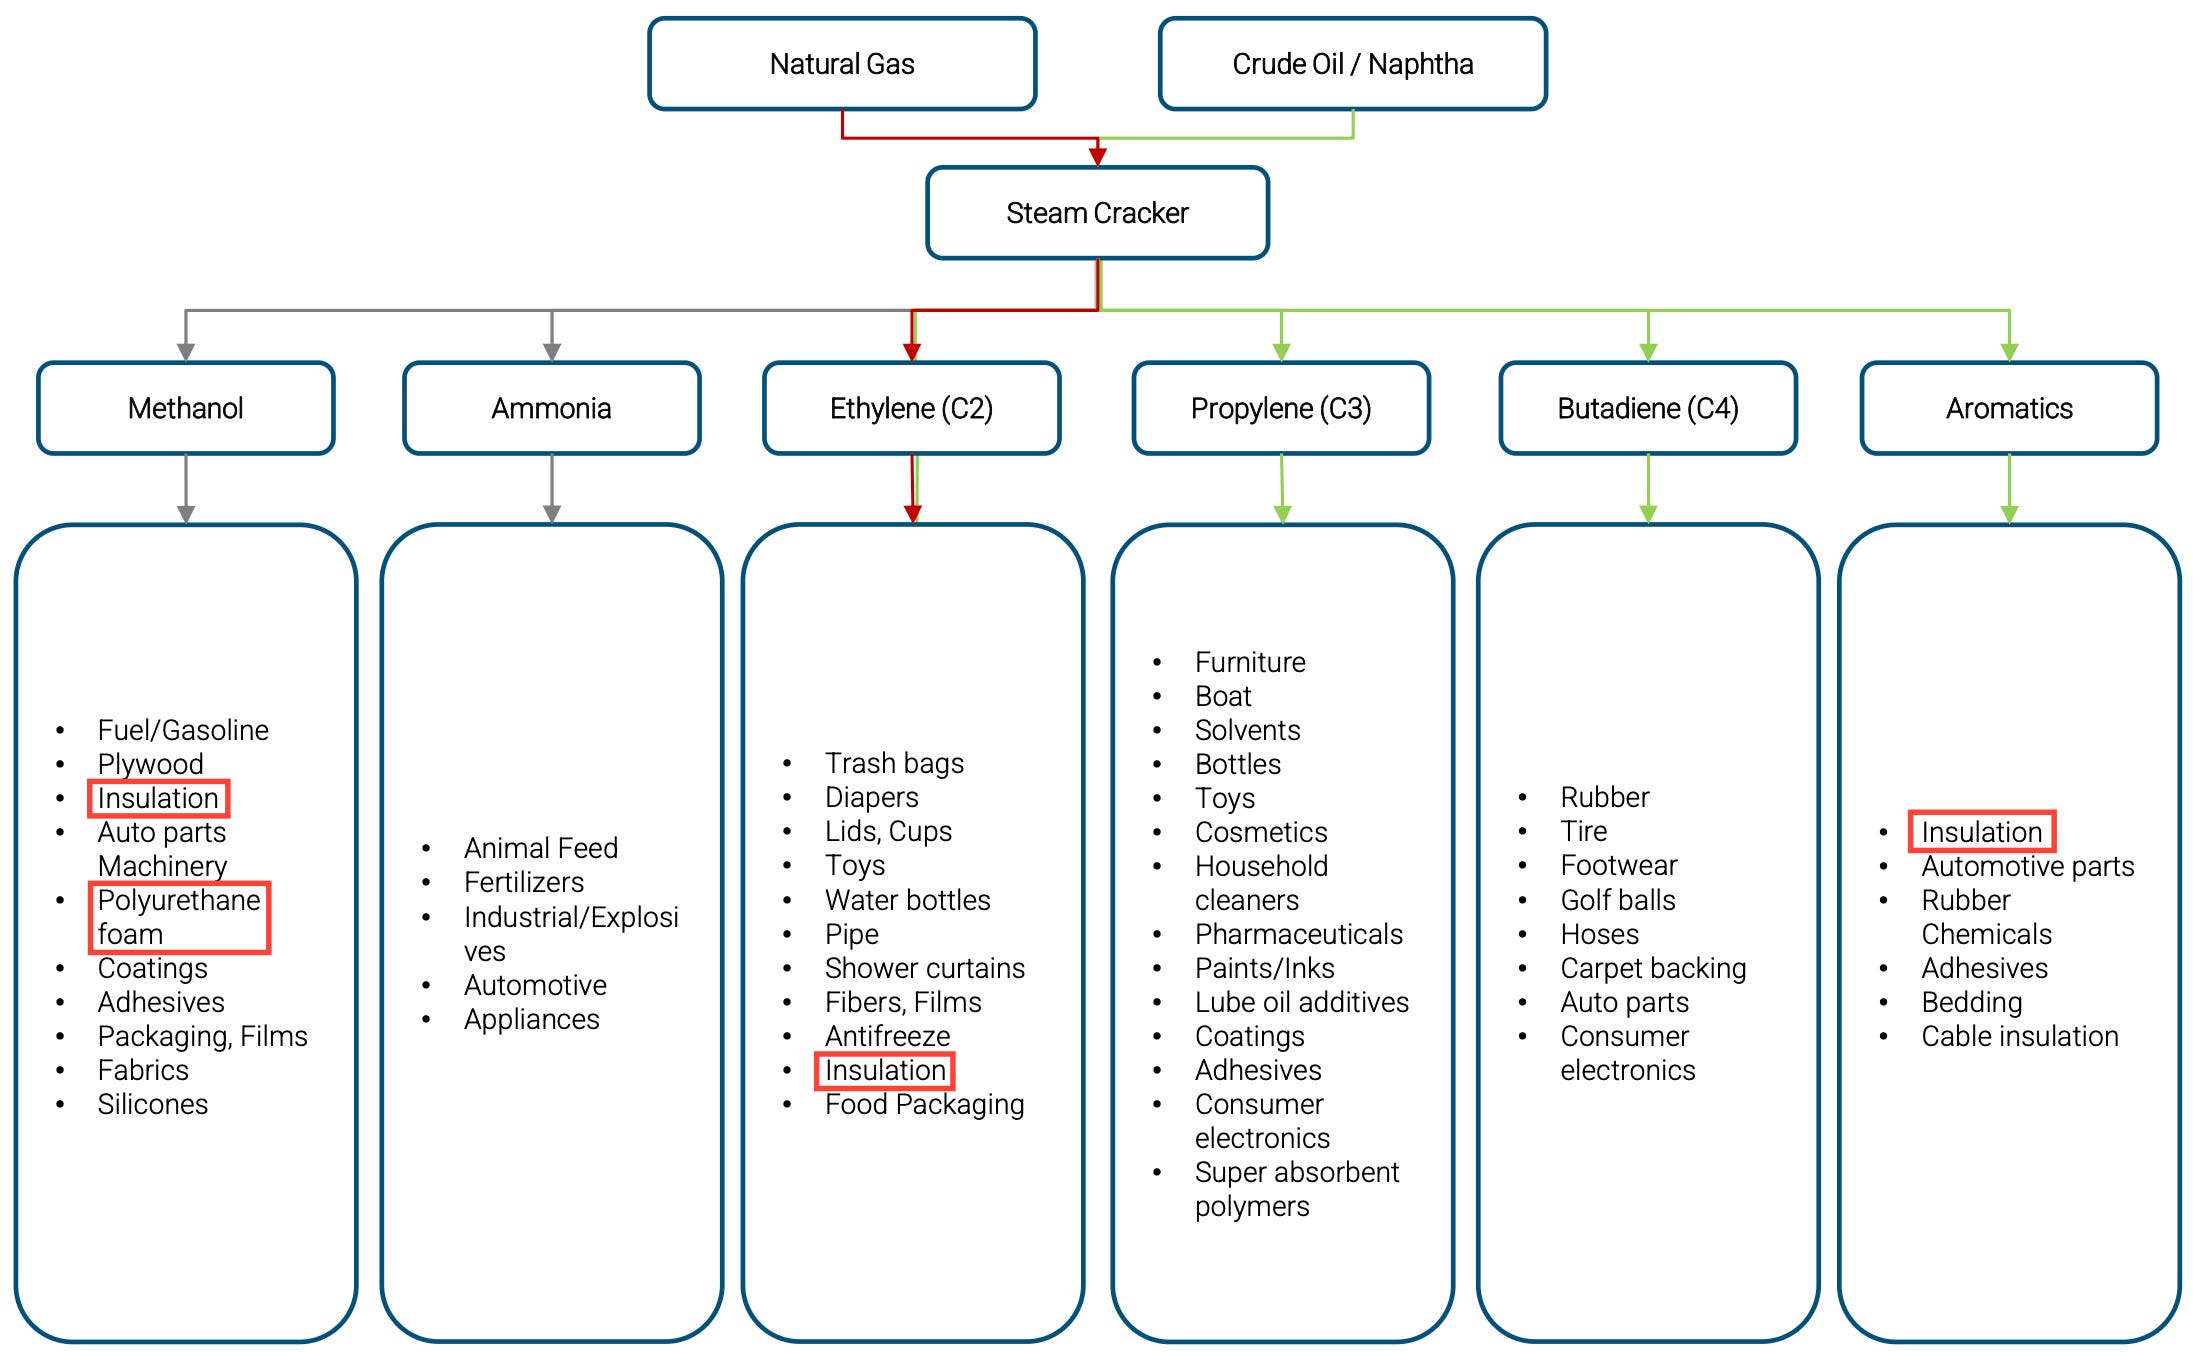
We have highlighted Insulation and Polyurethane Foam in red for a reason. Both are heavily tied to construction and housing activity, which is precisely the end market showing the earliest signs of a potential recovery in Europe.
When building activity picks up, these are among the first chemical derivatives to see volume growth, and volume flows directly into utilization rates at the plant level. Raw material costs, product mix, and geographic footprint determine how quickly a company benefits from a recovery.
A producer with low input costs and exposure to healthier end markets looks completely different from one facing weak domestic demand and a poor cost base. Getting that distinction right is where the real work lives. Chemical volume trends and utilization rates move before the shift shows up in broader data. We are watching this sector closely, and you should be too.
Stock Ideas: Air Liquide and WestLake
We will cover two names that stand out at this stage of the cycle.
Air Liquide is the higher quality name of the two. The French industrial gas giant operates with long term contracts, largely take or pay, which means volumes hold up even when the broader chemical environment weakens.
Air Liquide gives you exposure to a European industrial recovery with significantly less downside risk than most names in the sector. The company has compounded earnings reliably for years, carries a strong balance sheet, and trades at a premium that is historically justified. If European industrial activity accelerates, it will participate. If the recovery takes longer than expected, you still own a business that generates cash while you wait.
WestLake is a different kind of bet. The Houston based producer has significant exposure to PVC and chlor-alkali chemistry, both of which are closely tied to housing and construction demand. WestLake has been quietly building out its European presence, and the company benefits from a relatively advantaged feedstock position compared to many European peers still dealing with elevated energy costs.
When construction volumes in Europe start moving, WestLake is one of the names that feels it early and fast. The stock has underperformed the broader market over the past year, which is precisely why it is interesting now.
You are buying it before the recovery is priced in, and that timing is the whole idea. Both names sit at different points on the risk spectrum. Air Liquide is the patient, high conviction hold. WestLake is the higher beta way to play a faster recovery. Together they offer a sensible way to build exposure to a sector that the market is still underestimating.
4. Breaking Down the Chemical Stocks One by One
Now let’s get into what you are here for. What does all of this mean for DOW, LYB, HUN, and BAK? We go through each one.
The 2026 outlook for these names is shaped by a clear theme:
DOW and LYB recently received Buy upgrades as Middle East supply disruptions widen the cost advantage for North American ethane producers over naphtha-based peers globally. BAK sits in a different category, with its valuation tied to the final execution of the IG4 Novonor deal and the resolution of its Brazilian legal overhang.