
US-Iran: What’s at Stake for Oil Prices in the Conflict and How to Position for It
In this must read report, we lay out what we believe happens next, our best risk-reward ideas, and what to avoid.

This time-sensitive report breaks down the immediate implications of the U.S.–Iran escalation.
Unless you live on a remote island with no internet or belong to one of the few “Uncontacted Indigenous” groups left on Earth, you have undoubtedly heard about the current conflict between the U.S. and the Iranian regime.
President Trump’s decision to launch strikes against Iran has put a massive portion of the global oil supply at risk. While the Islamic Republic produces ~3.3M barrels a day, making up 3% of global output and ranking as the fourth largest producer in OPEC, its true power comes from its geography.
The nation sits right on the Strait of Hormuz which serves as the primary shipping lane for about 20% of the world’s crude from suppliers such as Saudi Arabia and Iraq. This waterway is the primary chokepoint for global energy markets and the current conflict between the United States and Iran has significantly elevated the risk of physical supply disruptions. As you can see below, this is arguably the most critical oil transit point on the planet.
Global Oil Trade Chokepoint
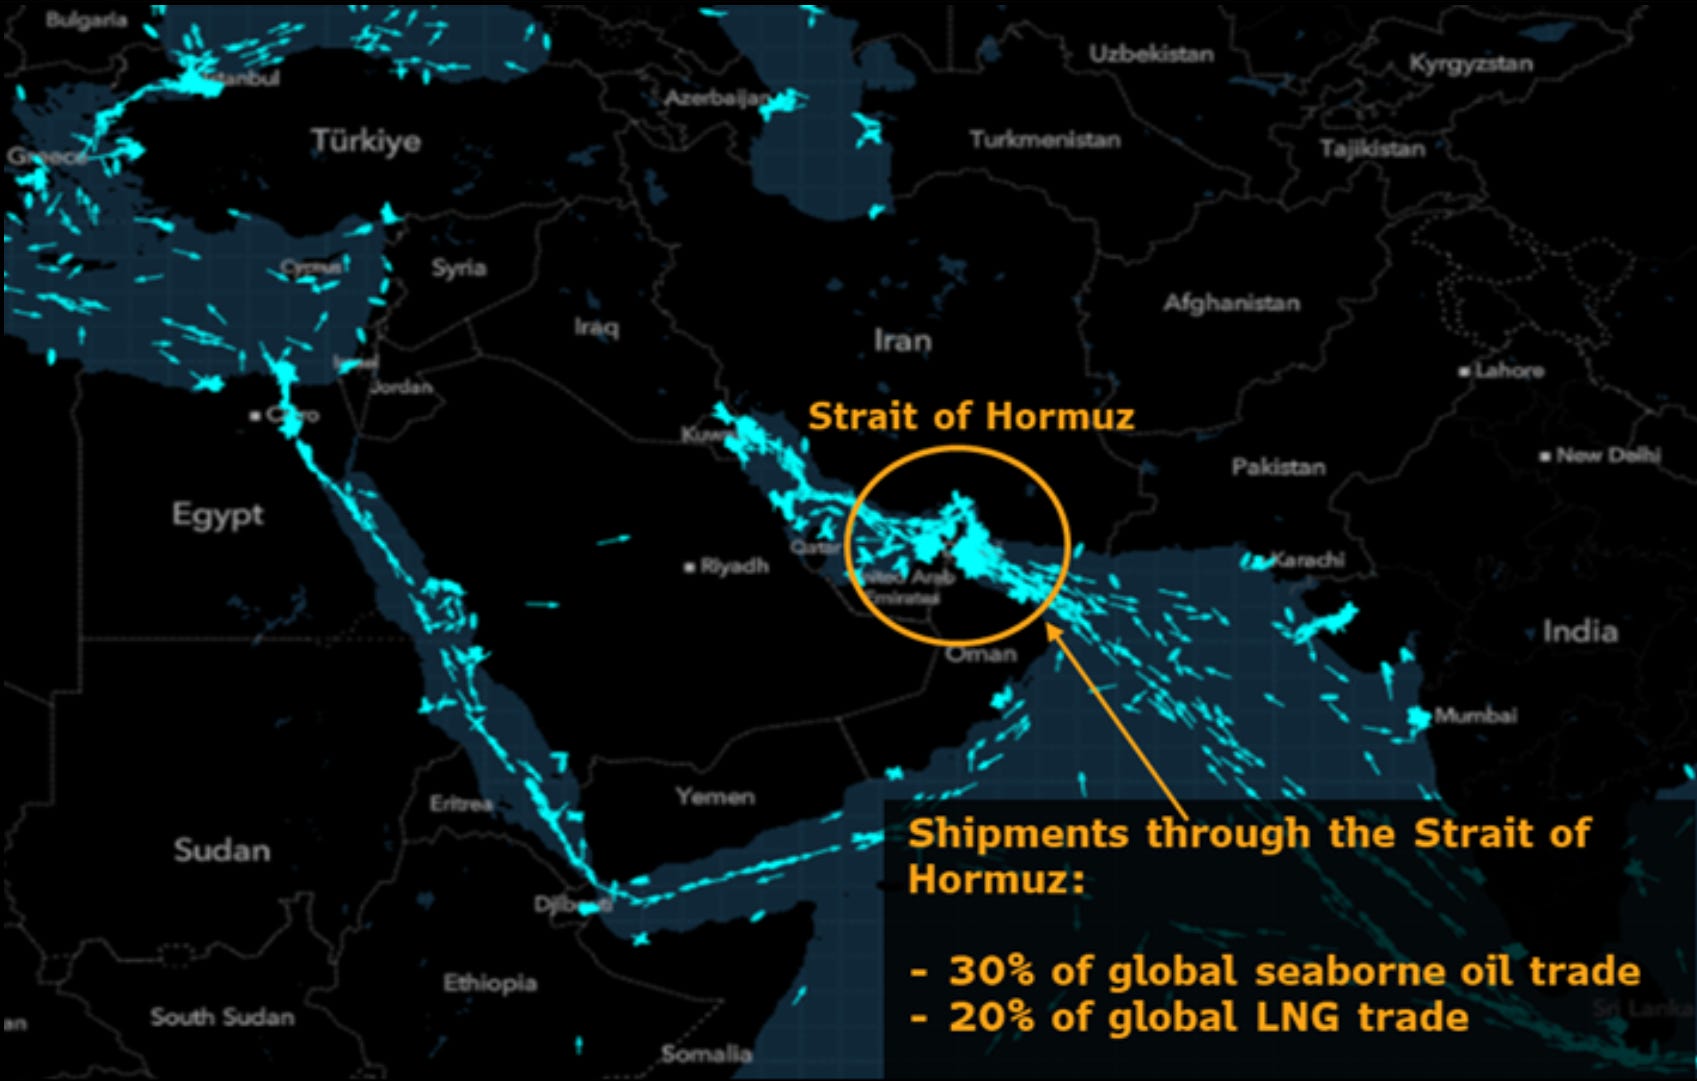
Iran’s potential to retaliate by obstructing this narrow passage threatens ~30% of all seaborne oil trade. Regional exposure for major importers is substantial given that Persian Gulf exports represented nearly 50% of total Chinese oil imports in December 2025. This volume translates to ~38% of China’s daily consumption and highlights why Asian markets are particularly vulnerable to a surge in energy costs as this geopolitical crisis unfolds. Since the attacks on Saturday, tankers have already started avoiding the area.
Reports from Iranian media indicate that the Strait of Hormuz is effectively closed, and shipping data confirms this as vessels are now clustering on both sides of the passage. Since markets are shut for the weekend, the full price impact hasn’t hit yet. While there is no confirmed evidence that major oil production or export infrastructure has been directly targeted, the situation remains incredibly tense.
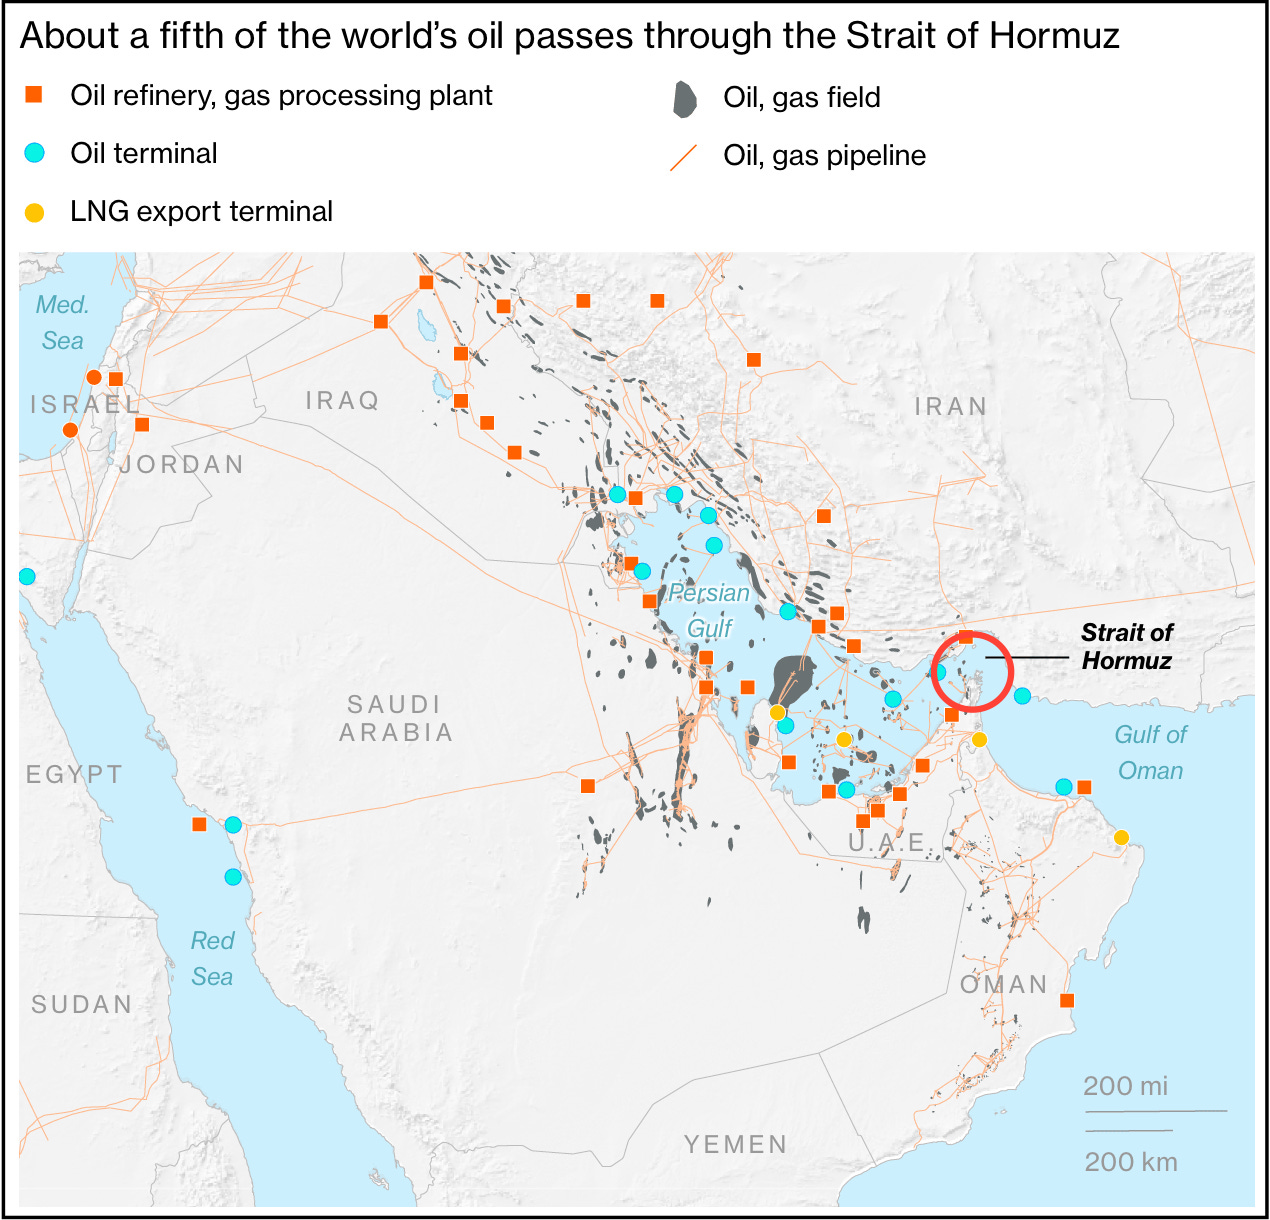
Oil Refineries & Terminals in the Middle East
The following map shows how quickly this conflict has spread across the Gulf. Explosions were reported on Kharg Island, which is home to the main oil export terminal for Iran. Missile activity has also been recorded near U.S. military bases in Kuwait, Qatar, Bahrain, Saudi Arabia, and the UAE. There were interceptions over Riyadh, blasts heard near Dubai, and smoke seen near the Al Udeid base in Qatar.
The Persian Gulf Is Now a Frontline in the US-Iran War
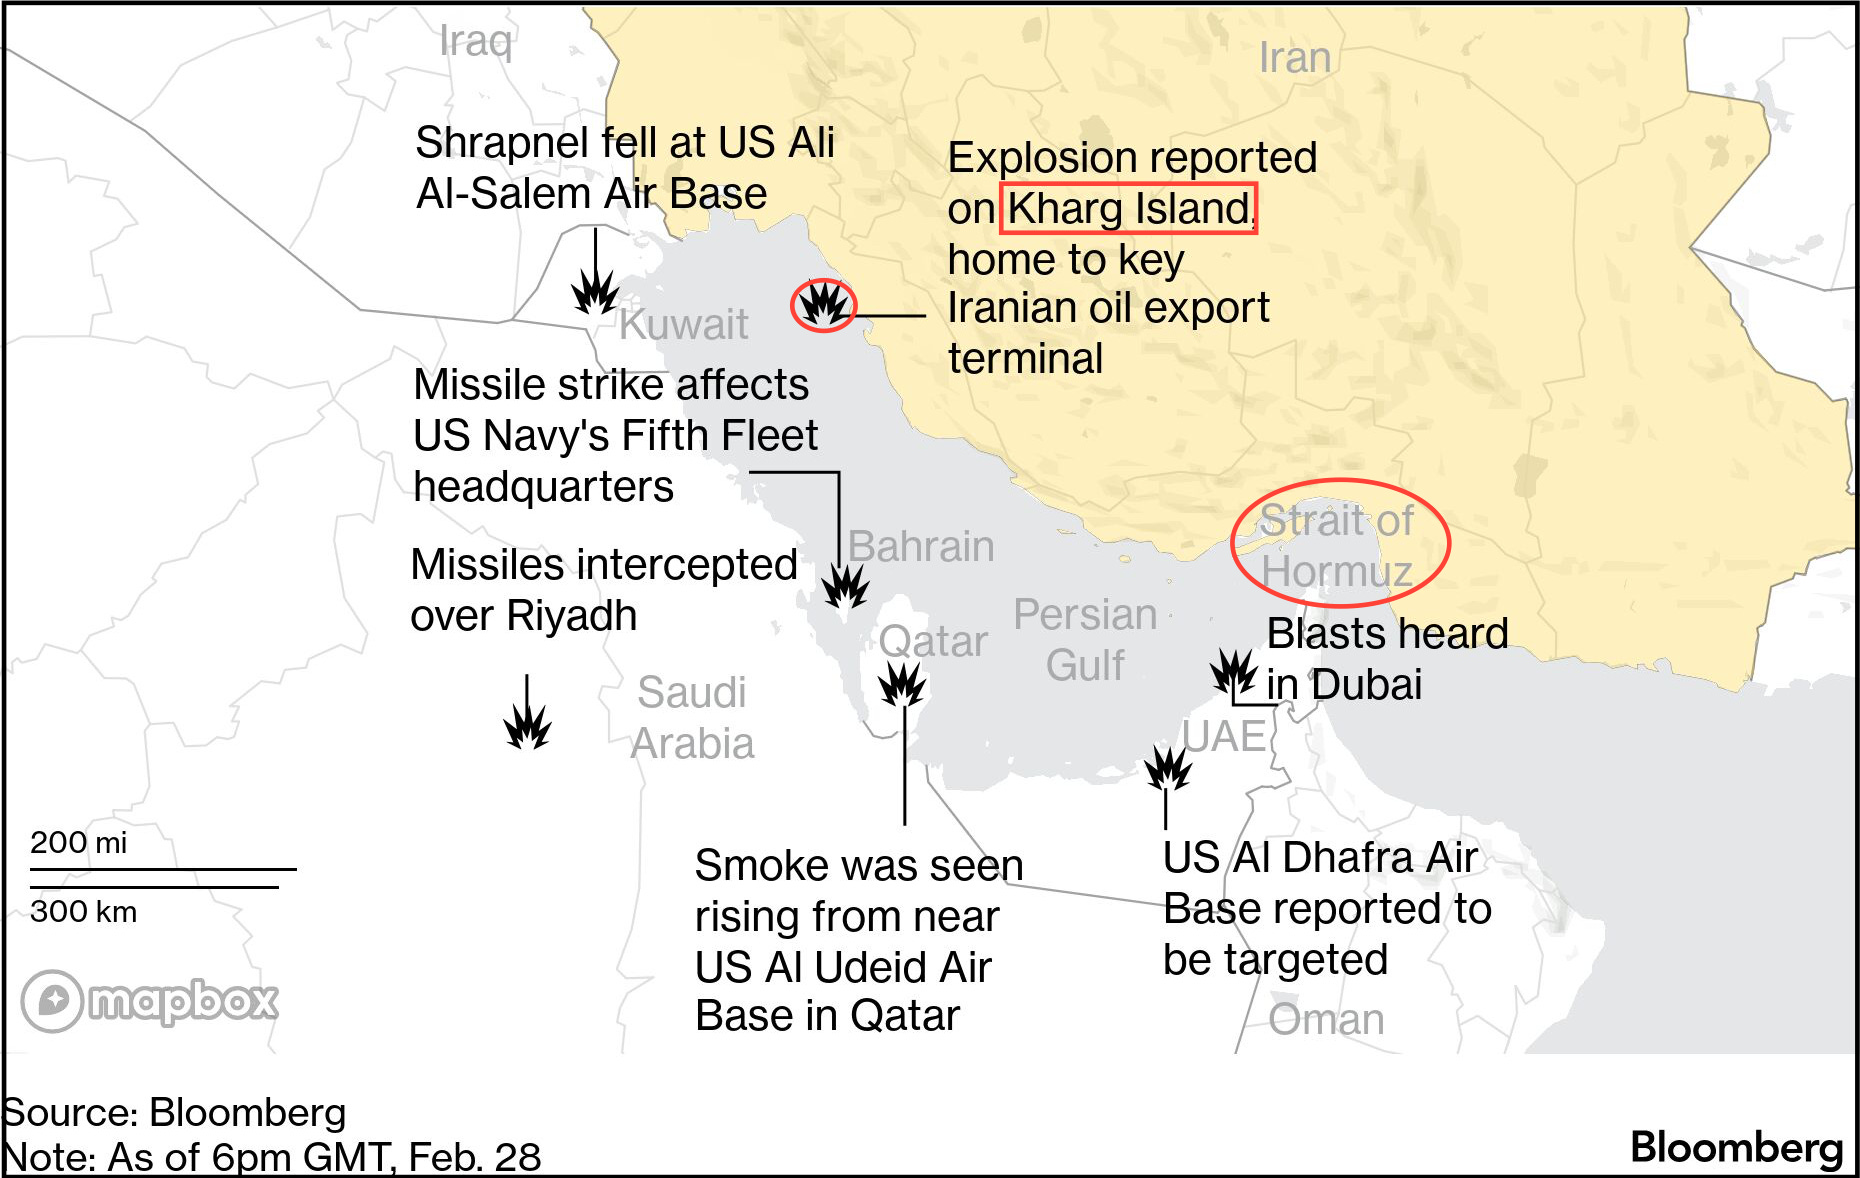
Even if energy facilities aren’t the primary targets right now, the high concentration of military incidents around the Persian Gulf creates a massive risk for accidental hits on shipping lanes, terminals, or storage hubs. Since ~20% of the world’s oil flows through the Strait of Hormuz, even a short blockage would severely tighten global supply and send prices skyrocketing.
Iran’s Oil & Gas Assets: What to Watch
Since 2020, Iran has managed to push its oil production up from under 2M barrels a day despite facing heavy international sanctions. They have gotten quite good at navigating these rules by sending ~90% of their exports directly to China. Most of this oil comes from the Khuzestan province, specifically from massive deposits like Ahvaz, Marun, and the West Karun cluster.
Iran’s Oil & Gas Assets Overview
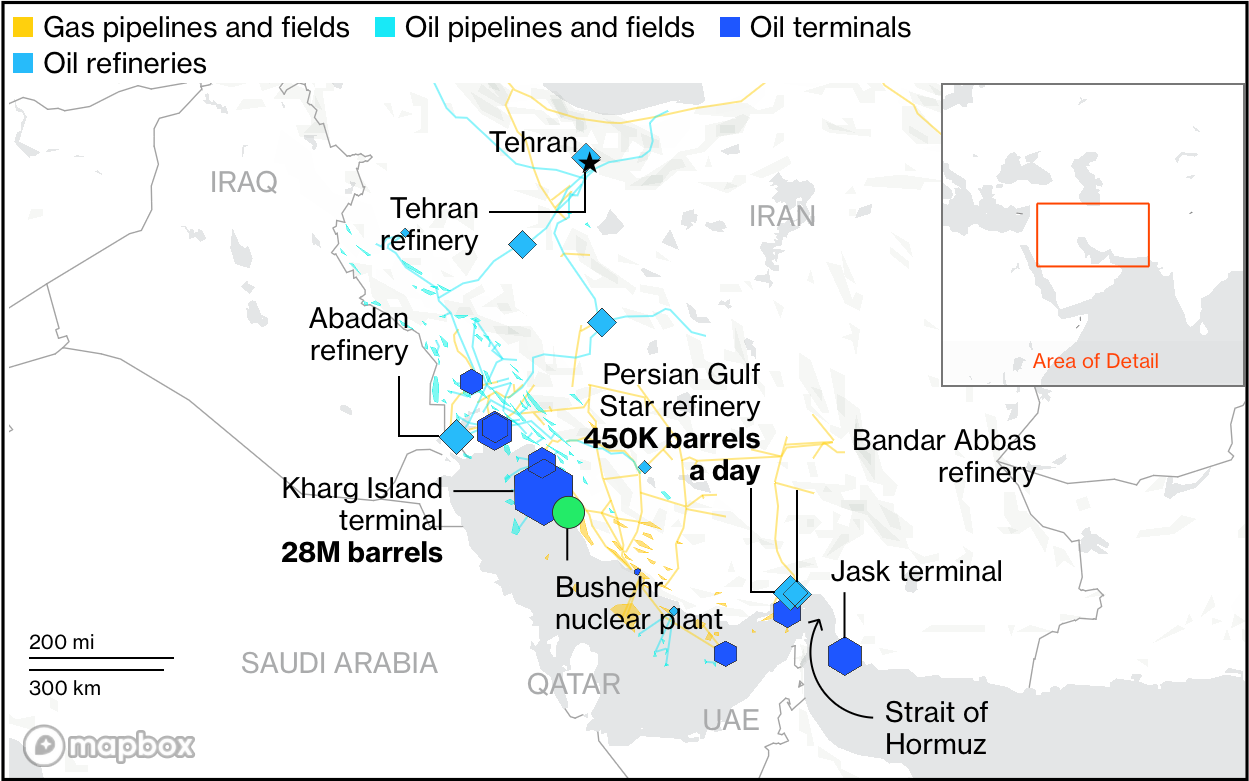
The refining side is equally important. The historic Abadan refinery, in operation since 1912, has a capacity of more than 500,000 barrels per day. Iran also depends on the Bandar Abbas and Persian Gulf Star complexes to process crude and condensate, an ultra light oil produced in large volumes domestically. Even the capital, Tehran, operates its own refinery to help secure internal fuel supply.
Kharg Island sits at the center of Iran’s export system. It is the primary logistical hub in the northern Persian Gulf, equipped with multiple loading berths and storage facilities capable of holding tens of millions of barrels. On Saturday, the Mehr news agency reported an explosion on the island. Details remain limited, and the oil terminal was not specifically identified, but the situation is being closely watched.
To keep revenue flowing, Iran relies heavily on private Chinese refiners that purchase its crude at significant discounts, as they are among the few buyers willing to overlook U.S. sanctions. These shipments are typically transported by a shadow fleet of older tankers that switch off their tracking transponders to avoid detection by U.S. authorities.
China Leads Oil Flows Through Hormuz
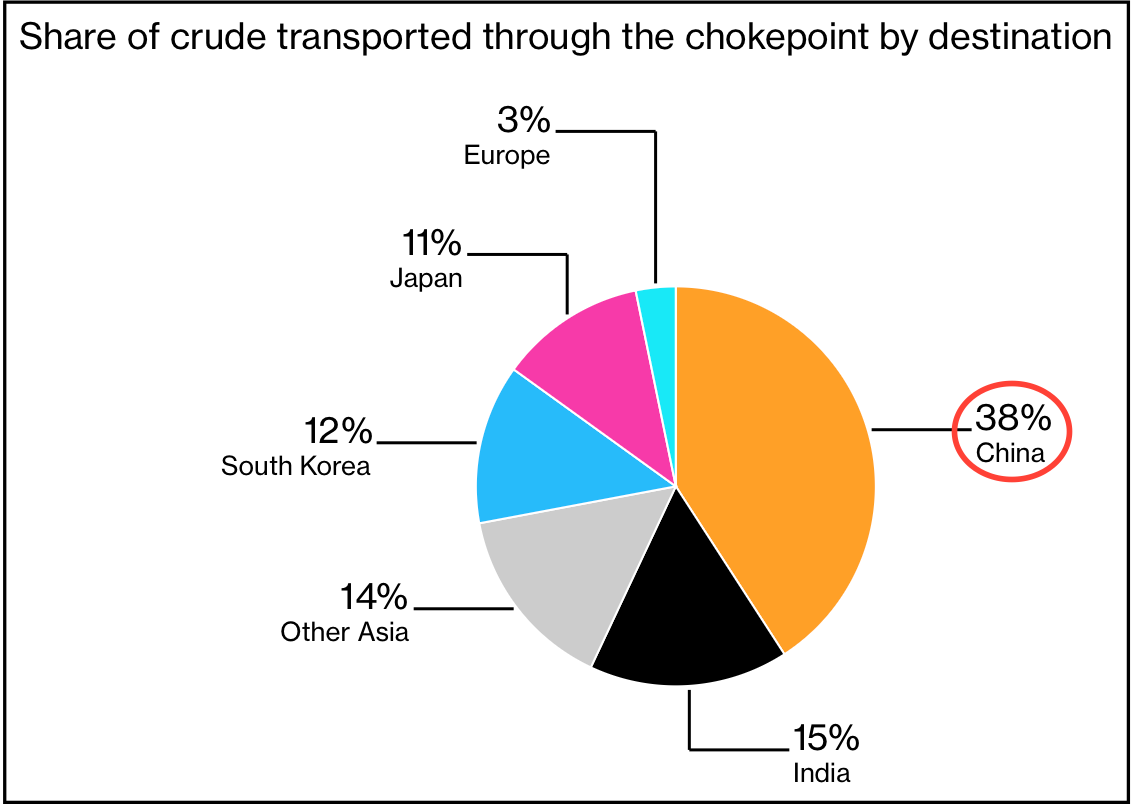
As the data below shows, China is the largest destination for oil traveling through the Strait of Hormuz. In fact, 38% of all the oil passing through that waterway is destined for China, which makes it the most exposed major economy to any disruption in the flow of crude from the Gulf.
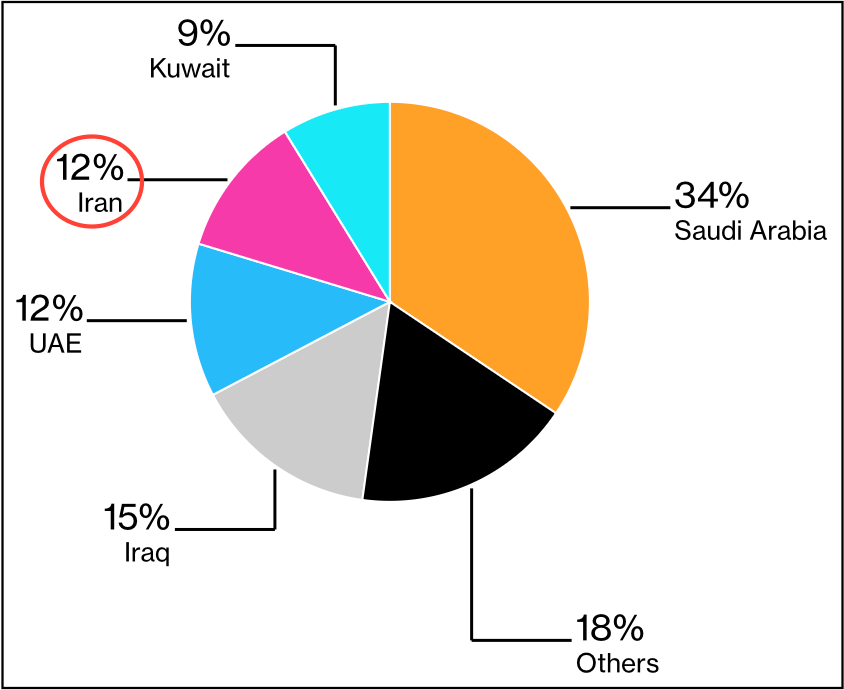
Iran’s Position in the OPEC Supply Balance
Despite years of sanctions and volatility, Iran remains a powerful force within OPEC. The country accounts for ~12% of the group’s total production, which solidifies its position as the organization’s fourth largest producer.
To see where the rest of the supply comes from, Saudi Arabia leads the group at 34%, followed by Iraq at 15% and the UAE at 12%. Kuwait contributes 9%, while the remaining 18% comes from all other member states combined.
Iran Is OPEC’s Fourth-Largest Producer
While Iran’s share is smaller than that of Saudi Arabia, the volume is still substantial enough to sway the entire market. Any major loss of Iranian output or exports creates a significant gap in the OPEC supply chain. We believe a disruption of this scale immediately tightens the group’s effective balance and forces other members to ramp up their own production to prevent a global shortage.
What Happens Next? Scenarios
Now that we’ve covered why Iran matters to the oil market, the next step is determining which scenario becomes the base case. Oil prices will move as the odds of these outcomes shift. The decision tree is simple and starts with whether the current leadership survives or collapses. A collapse would bring a political change such as democracy, a new ruler, or total chaos, and markets usually trade that uncertainty first if the transition looks messy. If the leadership stays in power, the next driver is how they choose to retaliate.
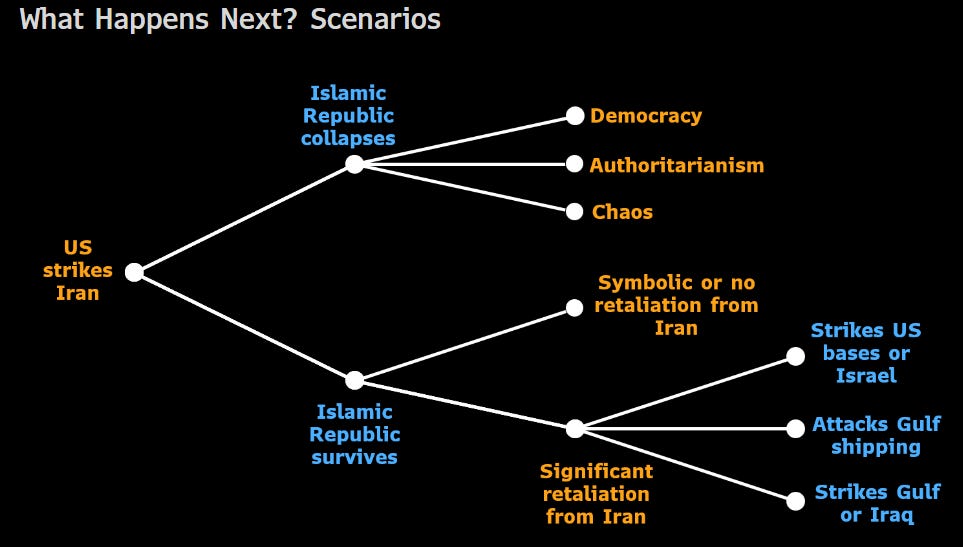
A symbolic response would maintain a risk premium in crude without causing a lasting supply shock, whereas a significant response involving strikes on regional bases or shipping is where the real upside risk originates.
This is where oil could gap higher, but any sustained move needs an actual hit to supply rather than just headlines. With crude expected to open around $80 on Monday, a jump from $70, a move toward $90 is plausible if tensions stay high. While a prolonged and extreme scenario involving a disruption of the Strait of Hormuz could theoretically push oil to $110, this outcome is unlikely since the waterway is the primary source of income for the Iranian leadership and closing it would effectively force their surrender.

We believe the most probable path leads to $90-100 because this range reflects the immediate war premium and higher shipping and insurance costs during a conflict. While the situation is tense, a move to $120 or higher looks unlikely because the global market is oversupplied and OPEC+ still has significant spare capacity that can stabilize prices. In addition, Iran depends on oil revenue for regime survival, so a full closure of the Strait of Hormuz would amount to economic suicide and offers no viable long term strategy. With these supply buffers in place and major buyers already holding large inventories, the market should find a ceiling before extreme levels, and anyone calling for $120 to $160 as a base case is overstating the situation.
Iran’s Risk Premium in Crude
The current market data from Bloomberg highlights that geopolitical risk has already contributed a six dollar premium to the price of oil as tensions between the U.S. and Iran escalated throughout early 2026. This premium has risen steadily alongside major events such as the movement of a massive naval armada and reports that the nations are moving closer to a major war.
Iran’s $6 Risk Premium in Oil to Rise After Attacks
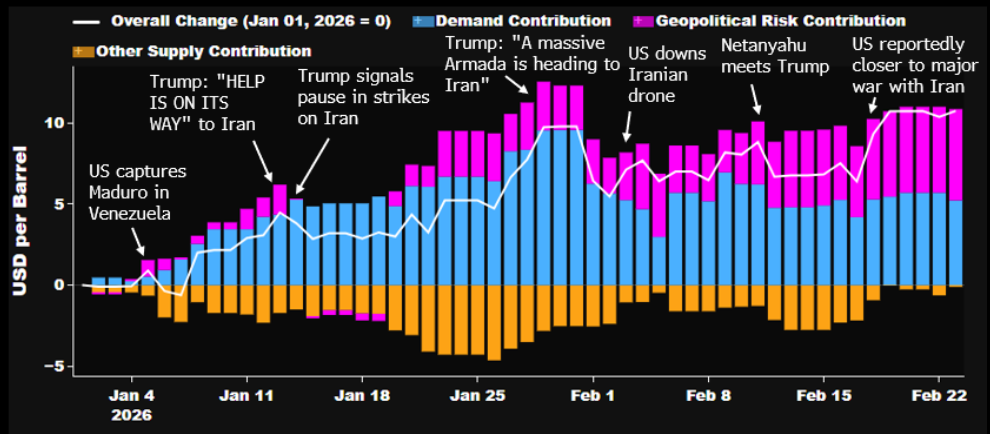
While demand factors and other supply shifts have fluctuated, the geopolitical contribution represented by the pink portion of the chart is now the primary driver keeping prices elevated above their January baseline. This data confirms that the market has transitioned from theoretical concern to pricing in a significant risk of physical disruption which currently accounts for the bulk of the recent move toward eighty dollars per barrel.
The Gulf Risk Premium Returns
The analysts who expected a quick, limited strike were wrong. For months, major firms argued that the government’s concern over the cost of living would keep any military action small. With midterms approaching, they assumed the downside of a long conflict was too large, effectively betting that economic optics would shape military strategy.
That bet has failed. The conversation has moved past narrow strikes on missile sites. The conflict has widened, and early assumptions of containment have broken down. Reports of retaliation across the region, combined with fresh concerns around Kharg Island and the Strait of Hormuz, have forced investors to reprice the entire range of outcomes.
Oil Prices Show a Rising Risk Premium
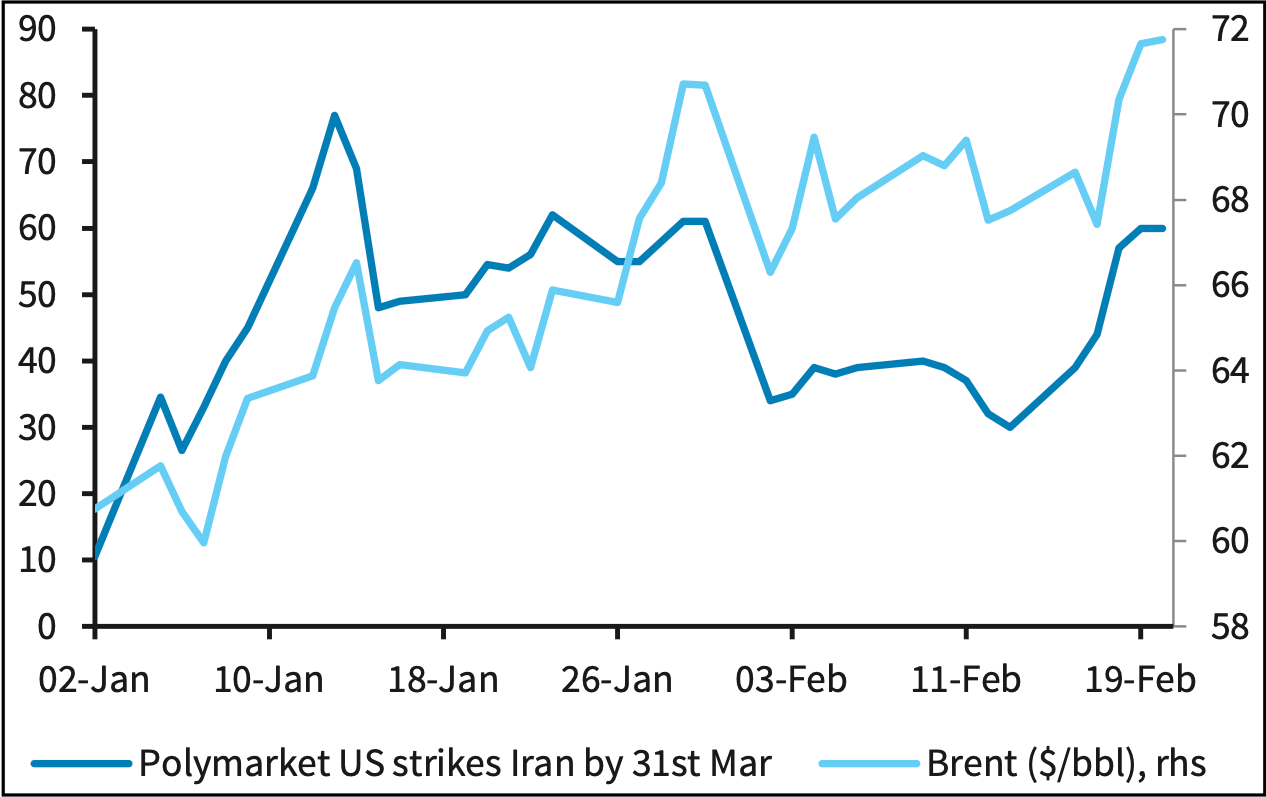
The chart above captures the upward shift in the oil risk premium. As the perceived odds of U.S. action climbed, Brent moved higher alongside them.
The price response was meaningful, but one to two weeks ago it still read like an early-stage repricing. Probability moves first, then the physical market follows once disruption becomes visible. Now the picture looks different.
Following this week’s escalation, crude oil has moved sharply higher as the market shifts from treating conflict as a distant tail risk to a core pricing reality. We are now witnessing a tug of war between two powerful and opposing forces. Escalation risk supports a significantly higher risk premium while political constraints favor a compressed timeline and intense pressure to limit economic fallout. From here, we believe the market next move will be dictated by physical realities such as whether vital shipping lanes remain open and whether export and refining infrastructure continues to operate normally as global markets reopen, so nothing is played out yet.
How to Position From Here
First of all, the following information focuses on what to avoid by looking at historical patterns. The most sensitive sectors should be avoided, while the least sensitive ones should be viewed as opportunities if a drawdown becomes overdone in macro and market sentiment, that is where we specialize in identifying value and where we generate most of our alpha.
What We Would Avoid:
The regional investment narrative during this conflict centers on the stability of Gulf energy infrastructure, logistics, and human capital mobility. While the initial equity market reaction would likely be a drop lower, investors will focus on the duration of the conflict and any medium to long term disruptions to these core sectors. Historically, the most vulnerable stocks in the region are real estate developers such as ALDAR, EMAAR, and Dar Al Arkan due to risks surrounding demand and pricing. Mobility names like Air Arabia and Parkin are also at risk from traffic impacts and higher oil costs, while ADNOC L&S faces potential trade and operational disruptions.
Gulf Equities Reaction to ‘12-Day War’ in 2025
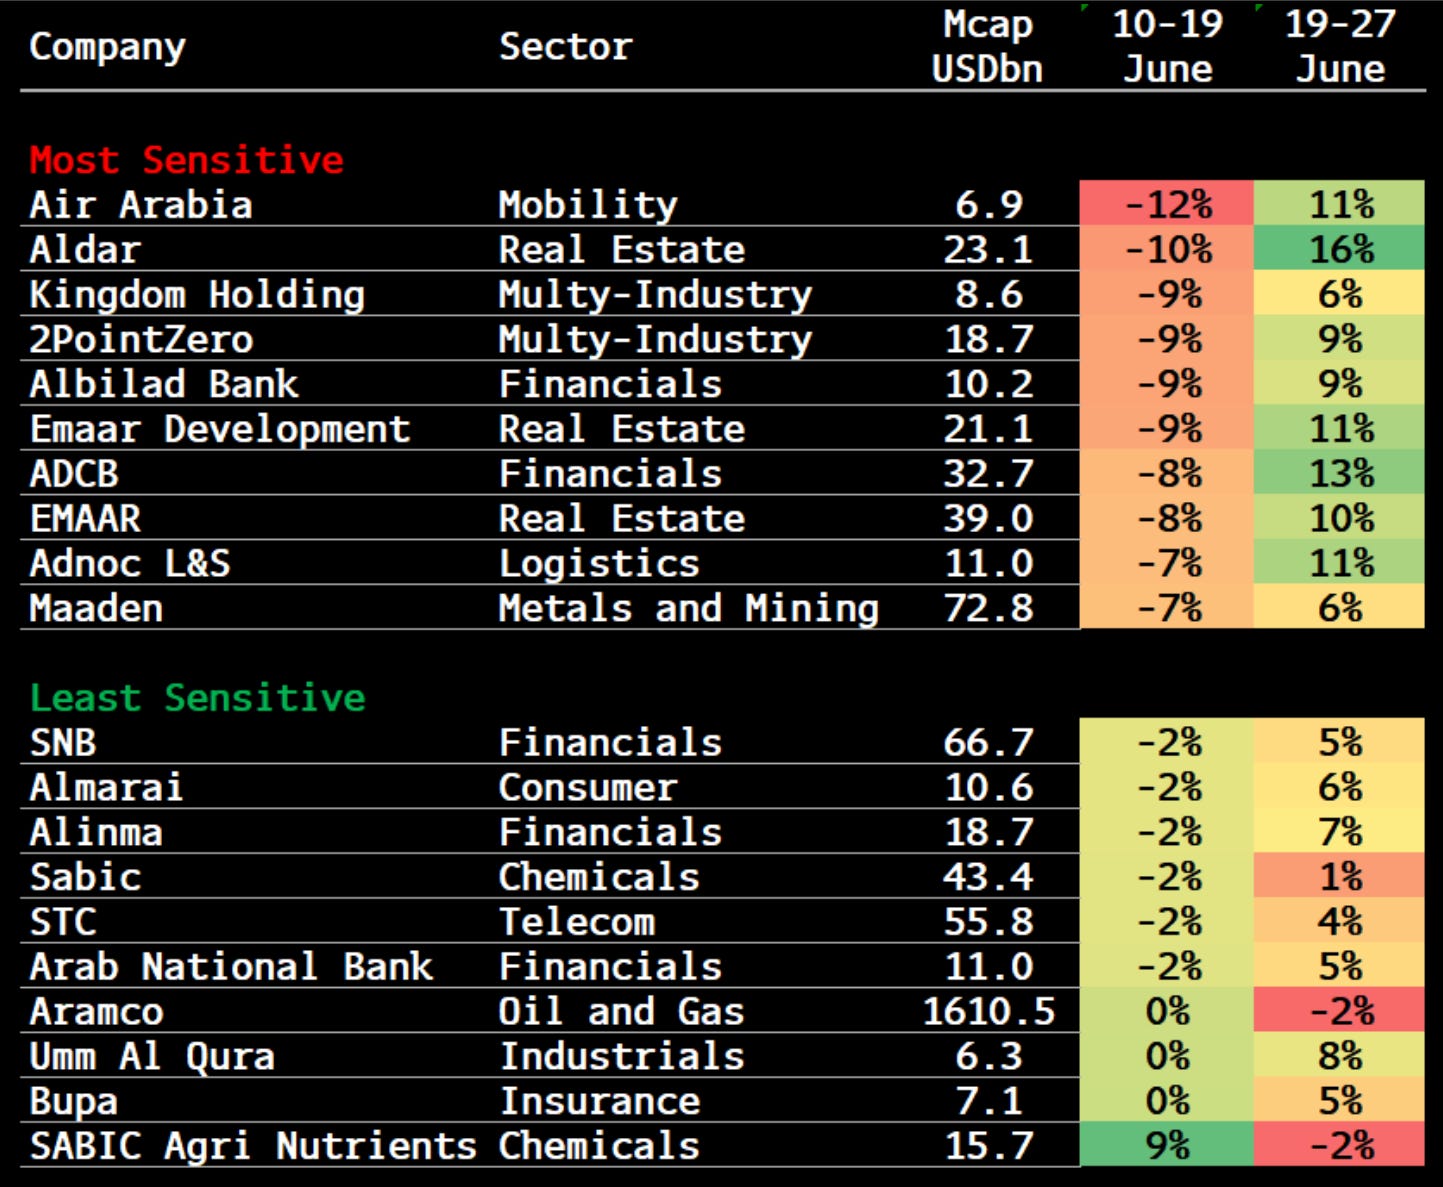
On the defensive side, Saudi Aramco remains the primary option due to its exposure to higher oil prices, though this only holds true if production and exports remain uninterrupted. Because these names are currently the most vulnerable, they should be avoided for the time being.
Where We See the Best Risk Reward:
It is likely you are most interested in identifying specific investment opportunities during this period of volatility. We believe that avoiding areas with excessive risk or overcrowding is the primary strategy for the short term. Canadian equities and the mining sector should perform well while defense stocks also offer a strong hedge. On the other hand, Latin America remains largely disconnected from this specific conflict and we continue to view Brazilian equities as undervalued with a compelling risk-reward profile.
While oil equities are an obvious choice, we believe that product tankers, crude oil tankers, and even dry bulk carriers will benefit significantly and deliver exceptional performance. According to a Tankers Opinion from Poten, there is very little risk that freight rates will decrease regardless of how the situation unfolds. The chart below illustrates this point clearly.
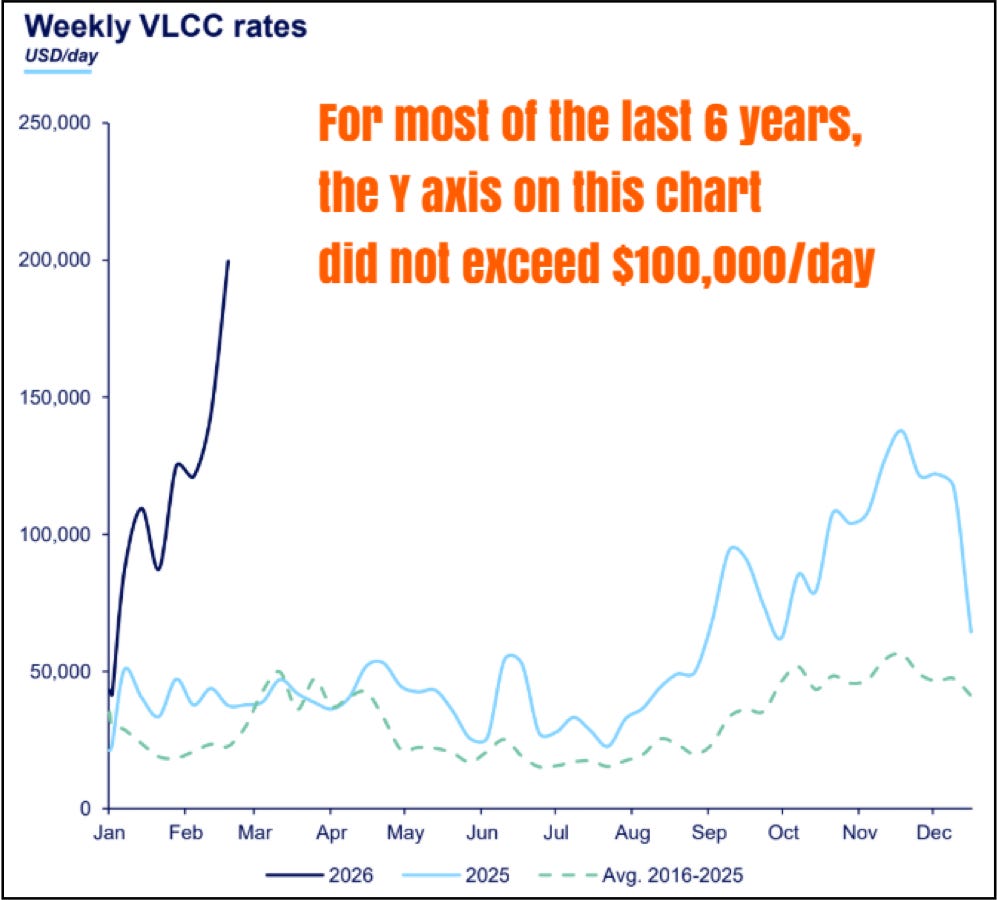
As we have mentioned many times before, the tanker market is already extremely tight with rates near historic highs and under these conditions the risk is entirely to the upside. We view this as a primary buying opportunity that is more attractive now than ever before.
The following two sections are bonus segments because they do not provide direct insights on the current situation but instead highlight historical events. Our goal is for these sections to help you learn how the market reached its current state by providing a clear view of the past.
How Oil Shaped the Modern World
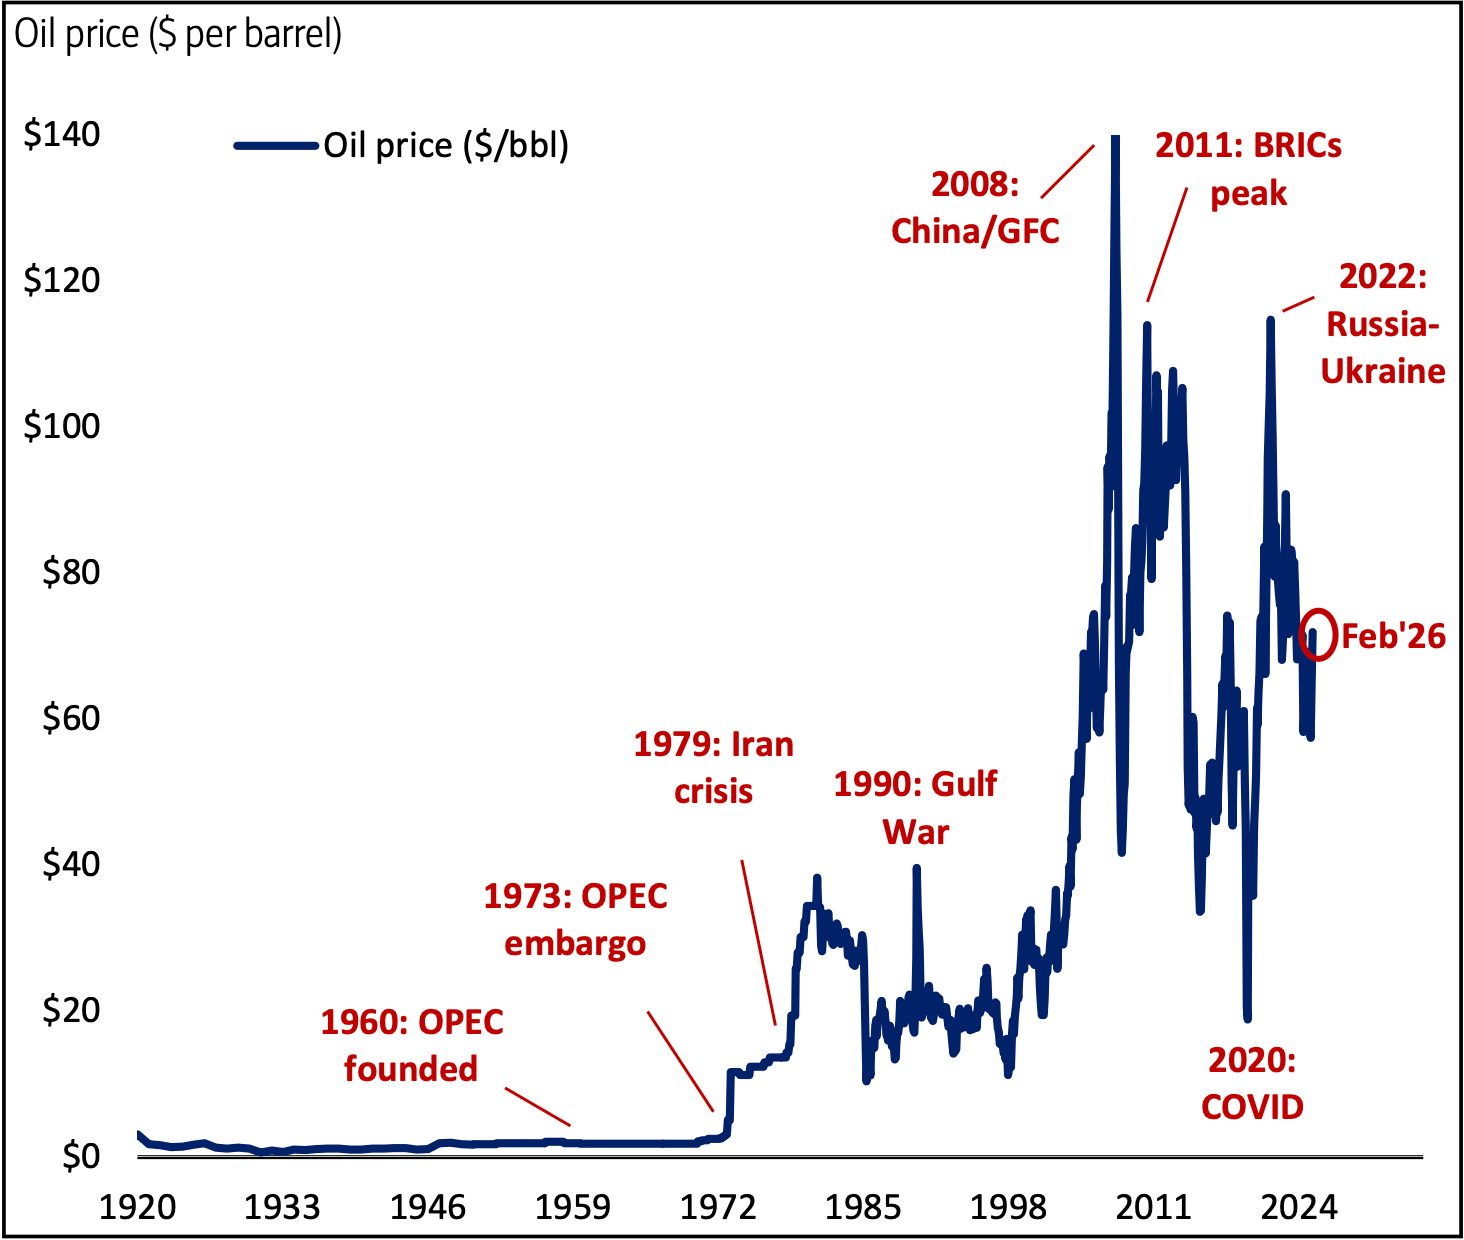
To capture the history of oil prices since 1920, it helps to look at the moments where politics and supply collided. The founding of OPEC in 1960 was a turning point, intended to stabilize the market, yet the decades that followed were often defined by volatility tied to disruptions in the Middle East.
Oil Price Since 1920
1. The Era of Major Shocks
The 1970s really set the stage for modern energy anxiety with two massive price shocks. During the OPEC oil embargo of 1973-74, prices actually x4. Not long after, the 1979 Iranian oil crisis caused prices to double again, cementing the idea that energy security was tied directly to global stability.
2. The 21st Century Rollercoaster
Moving into the 2000s, a perfect storm of soaring global demand, conflict in the Middle East, and a weakening U.S. dollar pushed prices to a record peak of $145 per barrel in July 2008. That high was short-lived, as the Global Financial Crisis sent prices crashing below $40. However, the recovery was swift, with prices bouncing back above $100 within just two years.
The mid-2010s introduced a new variable: the U.S. shale revolution. Between June 2014 and January 2016, prices plummeted from $115 to $28. This decline was intensified by geopolitical maneuvering between Russia and the Middle East, leading many to speculate about the end of OPEC. Of course, prices eventually recovered as global growth picked up speed.
3. Recent Volatility & Current Trends
The start of this decade brought unprecedented swings. In 2020, the combination of supply shocks and the collapse of demand during the pandemic forced prices down to $20 per barrel before they began to rebound. We saw another major spike in 2022 following the Russian invasion of Ukraine, but that momentum eventually cooled.
As of January 2026, the market has settled significantly, with crude oil trading around $65 per barrel. This recent decline is largely attributed to ongoing concerns about a global recession dampening demand.
The Persistence of War
If you look at the last 600 years, it is pretty clear that war was the rule and peace was the rare exception. Since the year 1400, more than 150M people have lost their lives in various conflicts. What is even more staggering is that over 100M of those deaths happened just since the start of the 20th century.
600 Years of War
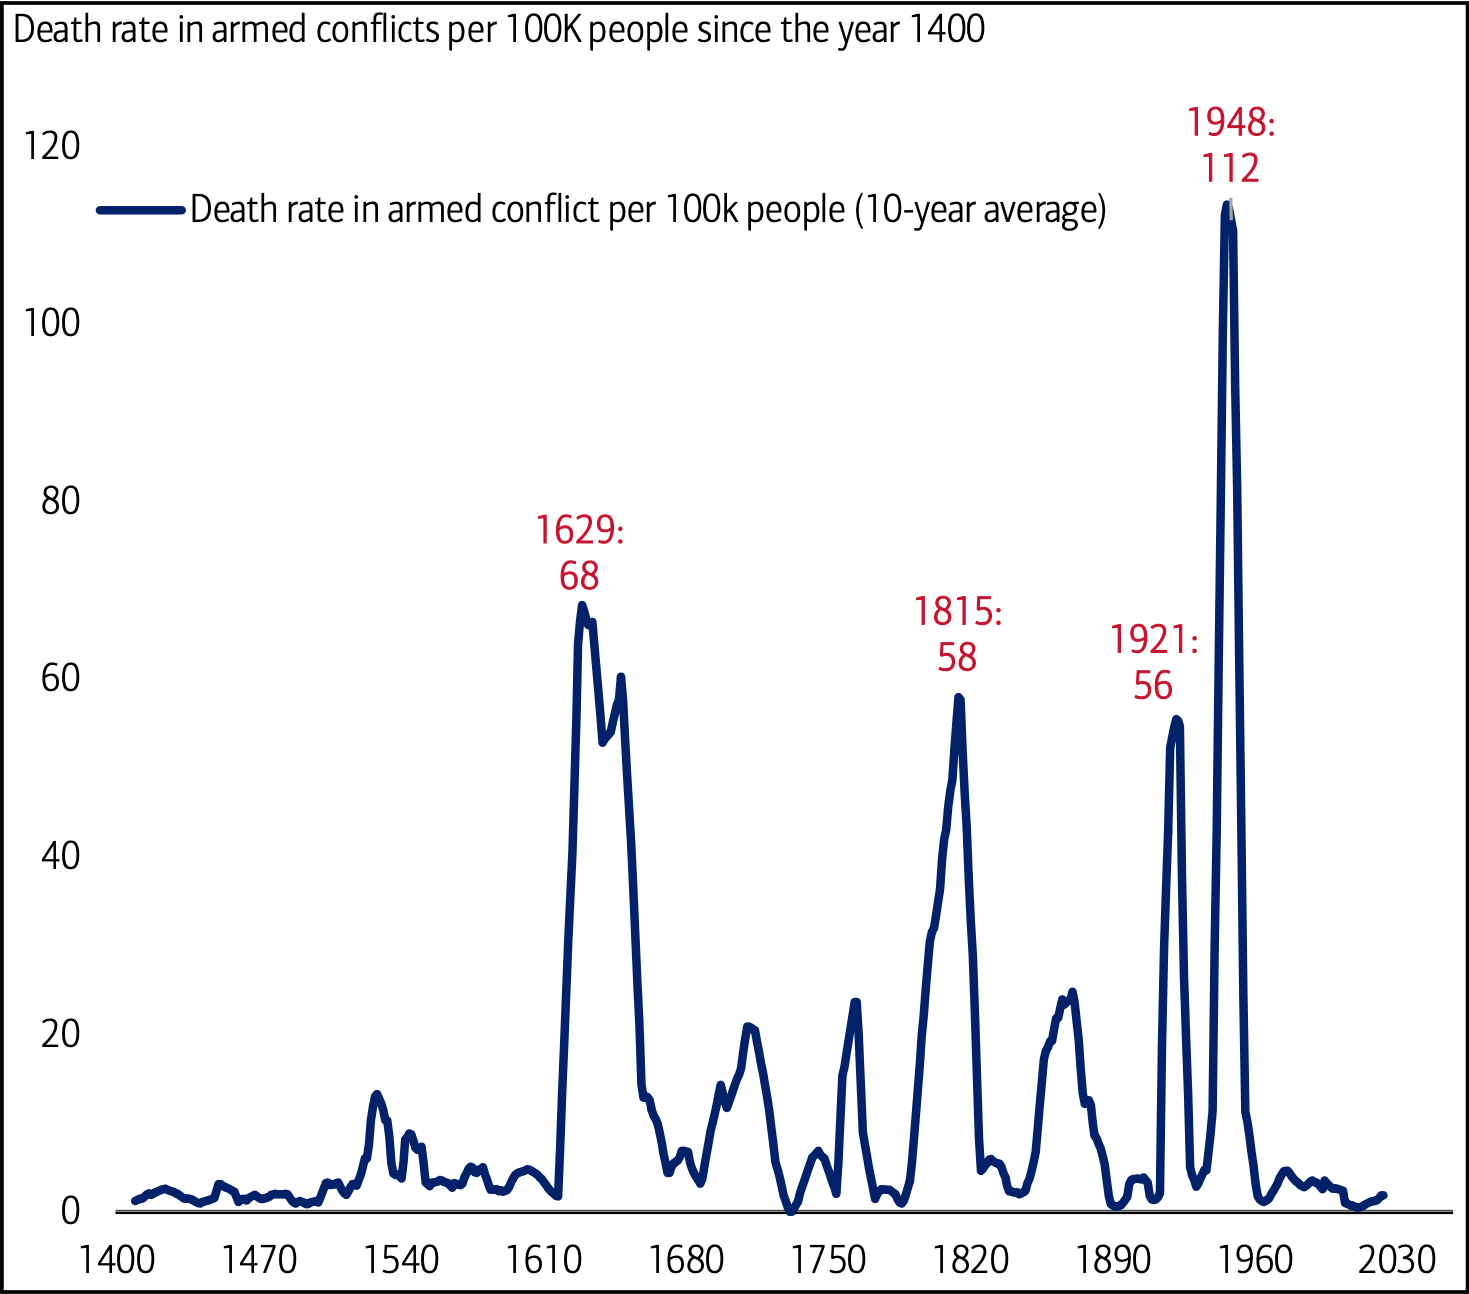
1. A Shift Toward Peace
Surprisingly, the 21st century flipped that script and made peace the new normal for a while. By the time 2011 rolled around, the number of deaths from armed conflict had dropped to its lowest point in 275 years.
Even though we have seen those numbers climb again over the last decade, the context is still important. In 2023, the death rate in armed conflicts was about 2 per 100,000 people. That is remarkably low when you compare it to the peak in 1948, when the rate was 112 per 100,000.
2. The Modern Reality
However, the return of war to Europe is a heavy reminder of the past. The current struggle involving Russia, Ukraine, and NATO actually marks the 487th military conflict in Europe over the last two thousand years. This tension is driving a massive surge in defense budgets, with NATO members committing to increase their spending by $700B before 2034.
At the same time, the ongoing tech war between the United States and China is forcing both economies to step up government intervention. They are pouring money into technology and defense for reasons of national security, which signals a major shift in how these global powers operate.
The Aurelion Team
Disclosures & Methodology
Brilliant article.
Good write up. Thank you.