
2026 Shipping Primer: The Trade of the Year
Field research, industry leader interviews, and our full playbook to understand and capitalize from the trade

We have been discussing shipping for over a year but never covered the industry in detail. In late 2024, major shipping stocks fell about 40%. We entered in early 2025, arguing the market was overlooking the fundamental supply shortage.
Our positions had more than doubled before the Hormuz situation, and now the sector has become even more mainstream. We believe the visibility of a continued upcycle in the industry has increased, making the sector a compelling investment.
This report is built on more than just sitting behind a Bloomberg desk.
We spent time on the ground conducting field research at a major North American port, speaking directly with the CEO of DHT Holdings (NYSE: DHT), the CFO of Nordic American Tankers (NYSE: NAT), and trusted industry experts to understand what is actually happening on the water.
Today we are re-entering TORM (NASDAQ: TRMD) in the Aurelion Index.
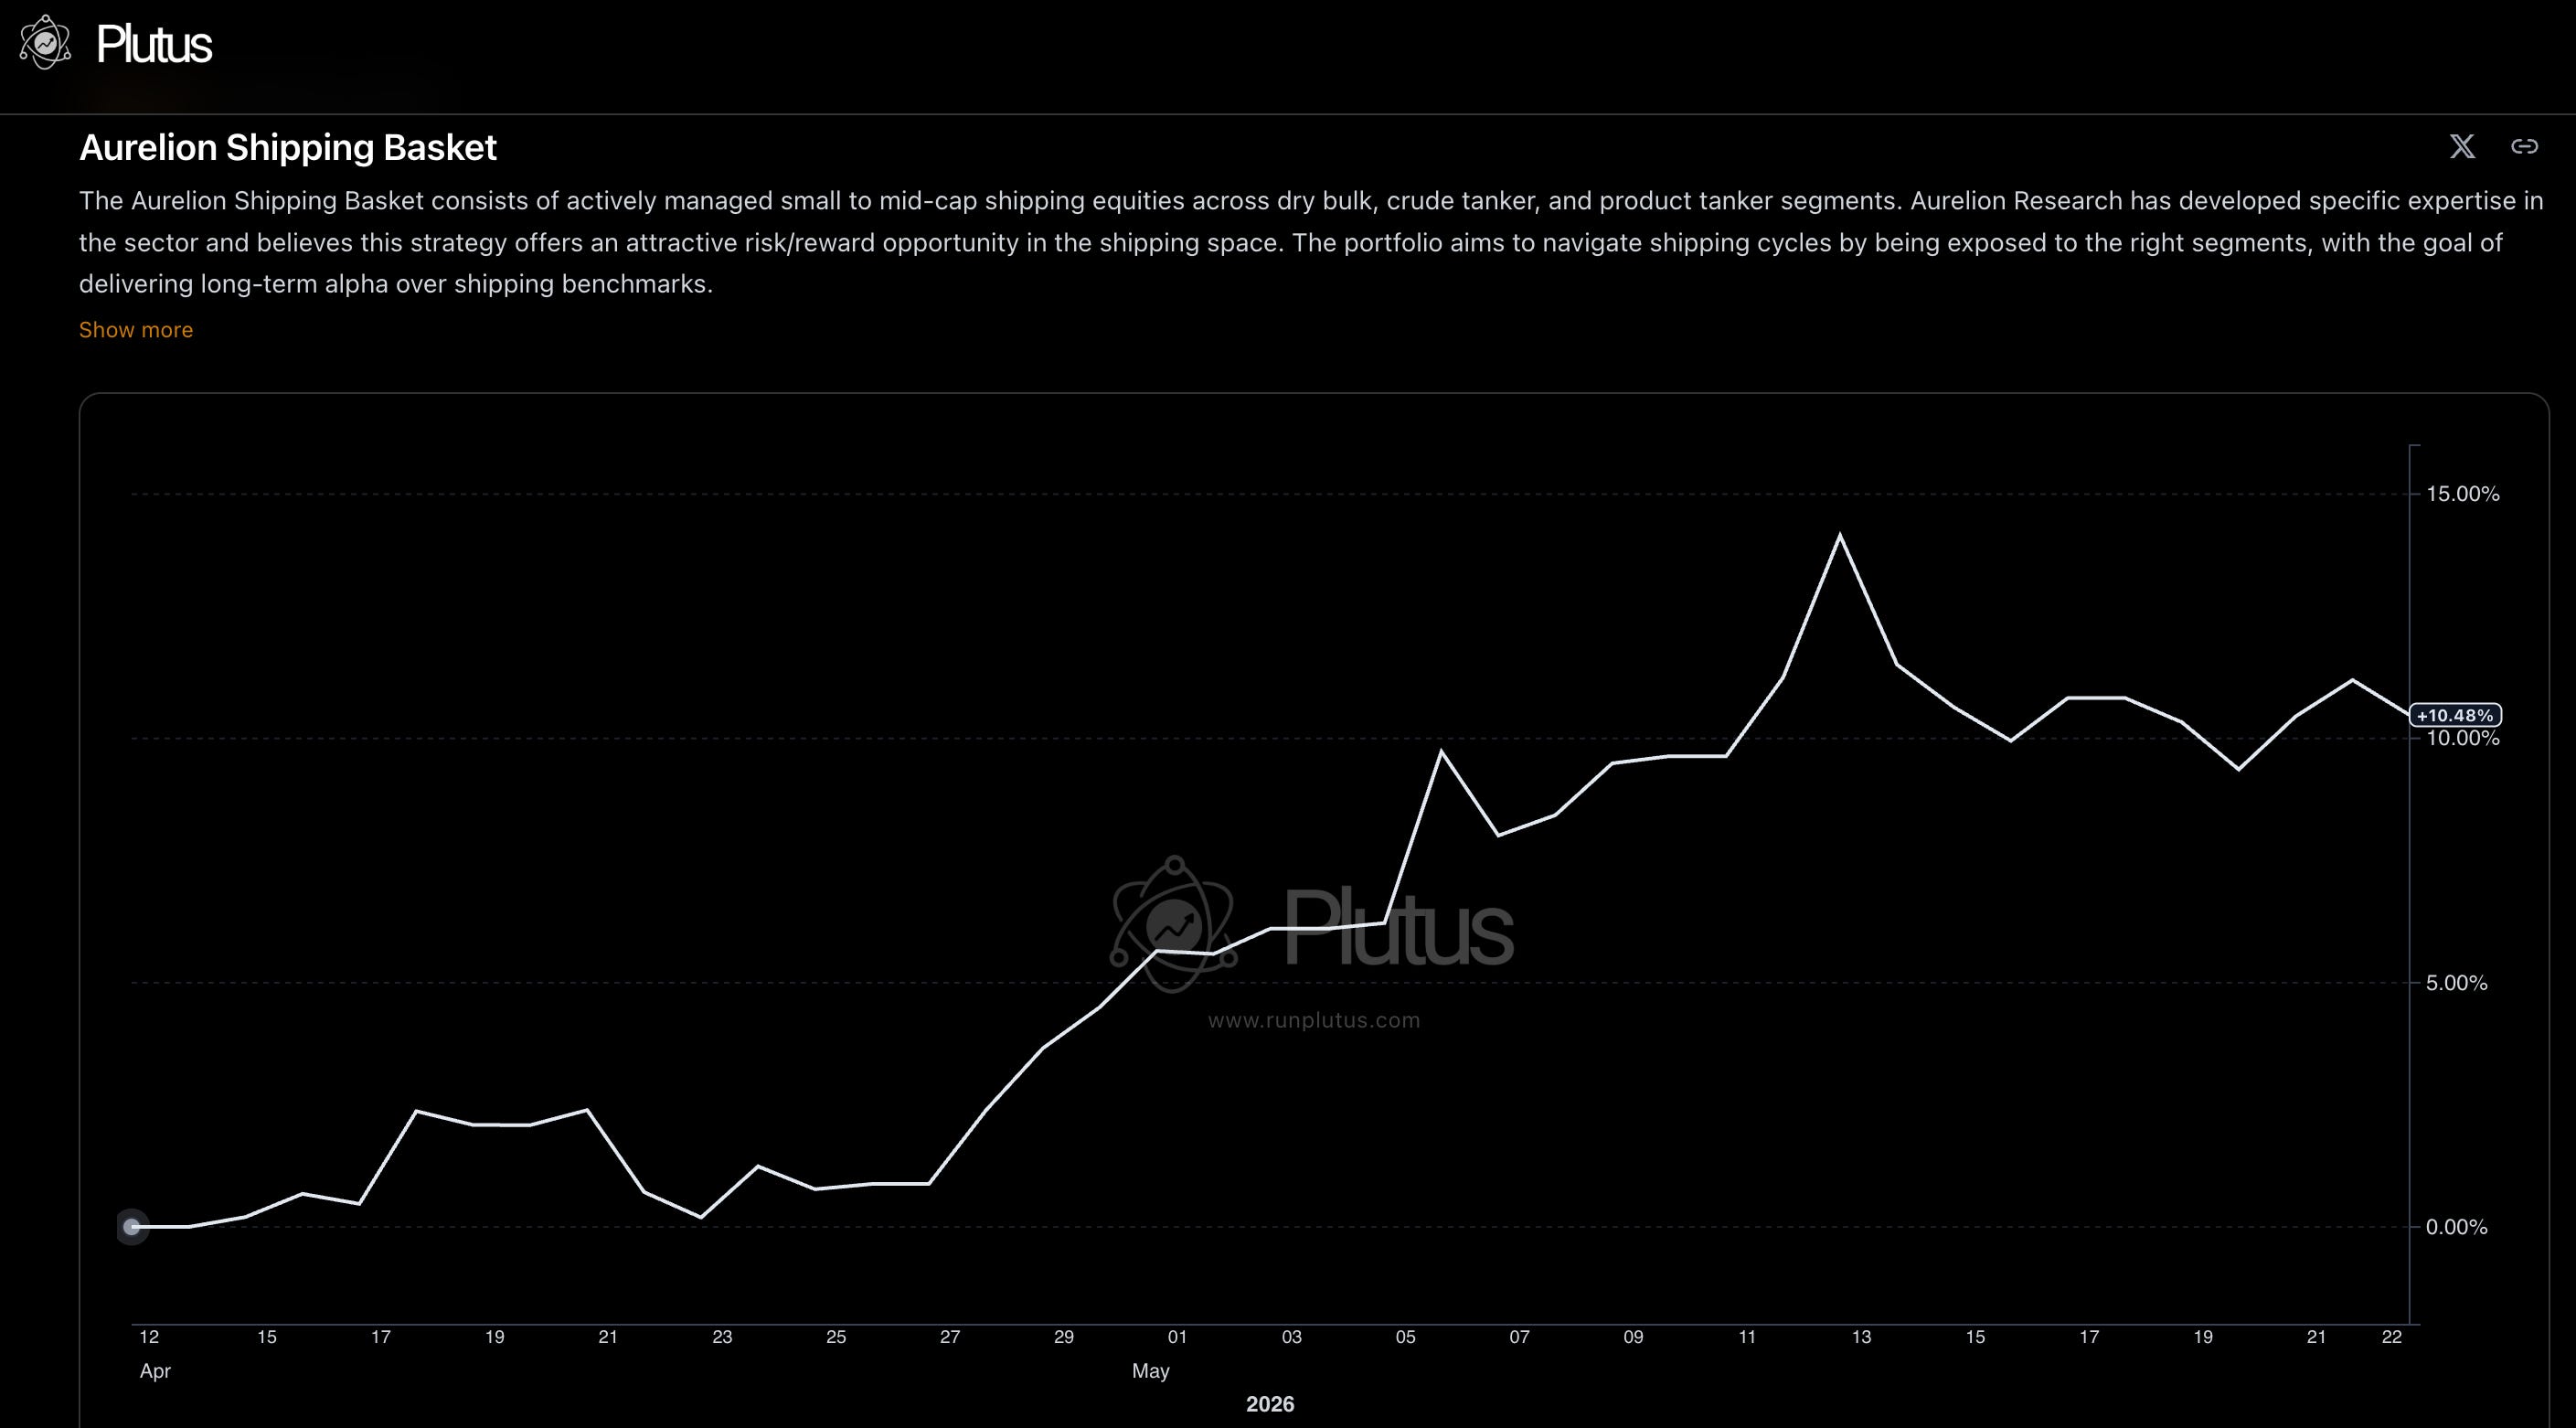
We have also created a Shipping Basket on Plutus, diversified among the best companies across the sector. We believe it is a strong risk-reward way to play the theme. You can access it here.
“Give me a ship and I shall move the Earth.”
Nearly everything we use, consume, or depend on has spent time on a ship. Shipping connects continents, carries economies, and keeps the world moving. It is the link between where things are made and where they are needed, and it never gets boring. That is why it is one of our favorite industries to cover.
This 2026 Shipping Primer is for investors who want to understand how this industry actually works, how shipping companies make money, and why the sector behaves so differently from most other businesses. More than that, it is a practical playbook for what is happening right now. The geopolitical disruptions reshaping global trade routes, the uncertain status of the Strait of Hormuz and the Suez Canal, and the macro forces driving rates and valuations all create real opportunities for those who understand the mechanics behind them.
Strait of Hormuz: A View From Space

One thing we want to establish early: in shipping, long-term value comes from how much cash a business generates for shareholders over time.
For decades, the industry has been fixated on Net Asset Value (NAV), which we think often leads companies to buy ships at peak prices with too much debt, treating shipping like a trading game rather than a business.
That mindset is part of why shipping companies remain small players in global capital markets despite moving the vast majority of world trade. We believe the companies worth owning are the ones that have moved past that approach.
Whether Hormuz and the Suez Canal normalize or remain blocked through 2026, this report is intended to give you all the tools you need to understand what is happening in the shipping market and how to position your portfolio accordingly.
Table of Contents
Introduction:
Iran is Running Out of Time
1.1 The UAE Has Held Up Well
1.2 The China Narrative Does Not Hold
1.3 The Clock Is Running
Are Kharg Island’s Oil Docks Empty?
2.1 What it Means for Oil
2.2 What it Means for Shipping
Inside One of North America's Largest Ports
The Main Segments of the Shipping Industry
4.1 Dry Bulk Shipping
4.2 Tanker Shipping
4.3 Container Shipping
4.4 Specialized Segments
What We Learned From Speaking With Shipping Executives
5.1 CEO of DHT
5.2 CFO of NAT
2026 Outlook for Shipping Market
6.1 Crude Tanker Market
6.2 Dry Bulk Market
6.3 Product Tanker Market
6.4 Container Market
2026 Outlook for Shipping Rates
7.1 Crude Tanker Rates
7.2 Dry Bulk Rates
7.3 Product Tanker Rates
7.3 Container Rates
Our Favorite Shipping Stocks
8.1 Top Idea #1: Okeanis Tankers
8.2 Top Idea #2: TORM Shipping
Additional Stocks Worth Following
9.1 Himalaya Shipping (Dry Bulk)
9.2 Star Bulk Carriers (Dry Bulk)
Our Final Take on the Shipping Market
1. Iran Is Running Out of Time
Before diving into shipping, we need to step back and look at the bigger picture. The situation in Iran is the single most important factor shaping global markets and the shipping industry right now, and we think the market is misreading it. Most people believe this conflict will last a long time. We do not, and here is why.
Before the conflict began, Iran's economy was already under severe pressure. Inflation was running above 40% annually, the rial had lost a significant portion of its value, and the country was running persistent budget deficits. The chart below shows just how long Iran has been borrowing to fund its operations, with primary deficits stretching back decades and government debt rising steadily.
Since the conflict started, things have gotten considerably worse. The IMF now projects Iran’s economy will shrink by 6.1% in 2026, with inflation approaching 70%. What makes this particularly telling is that despite all the geopolitical noise around Iran’s military capabilities, its defense spending as a share of GDP has actually been modest and declining for years, sitting at ~2% in recent years.
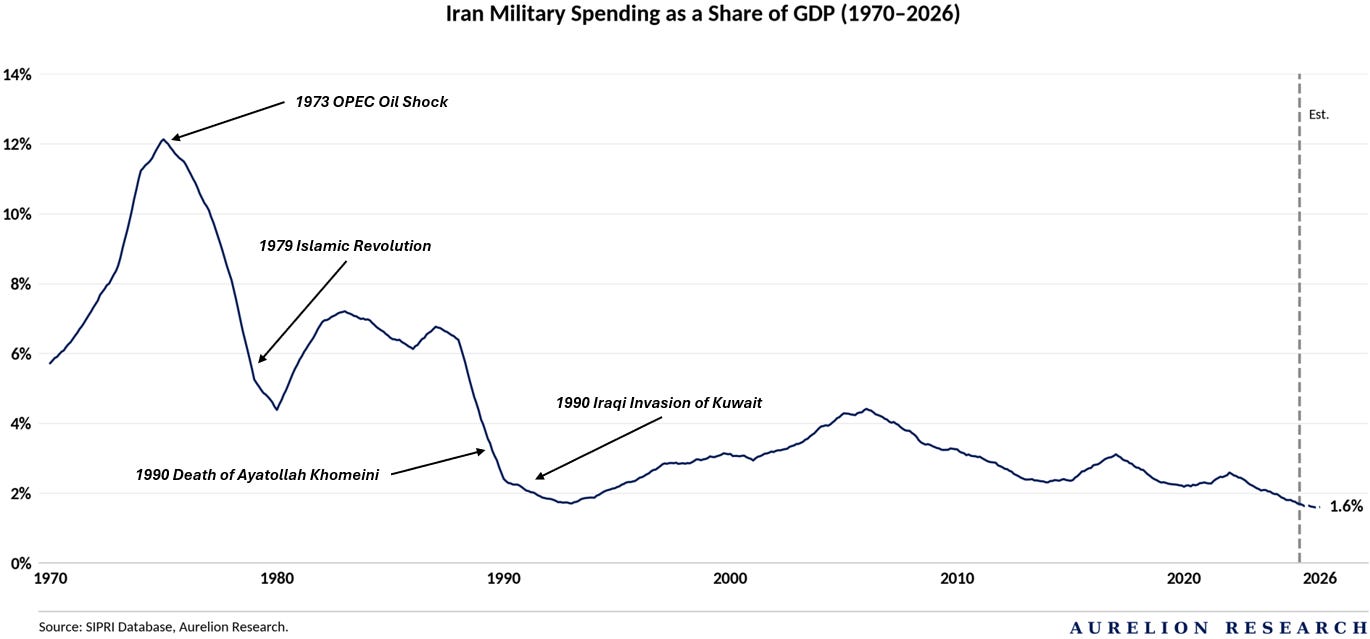
Stockholm International Peace Research Institute (SIPRI).
The 2026 figure is a research estimate adjusted for domestic inflation. Note that official figures exclude off-budget spending, including direct IRGC oil revenue allocations used to fund drone and missile programs.
The Limits of Iran’s Missile Stockpile
US intelligence estimates that Iran holds the largest domestic missile stockpile in the Middle East, including over 3,000 ballistic systems. However, a stockpile is only as useful as the industrial base behind it. Recent military strikes heavily targeted four critical production facilities, destroying the specialized industrial mixers needed to blend solid fuel. This operational damage effectively freezes Iran’s capacity to build new short and medium range ballistic missiles.
We believe financial constraints prevent a quick recovery. Replacing high precision mixers requires specialized imports that demand hard currency.
With oil revenues restricted, the regime must choose between military funding and internal stability. In our view, the legacy stockpile creates an immediate threat, but the lack of replacement capacity prevents a prolonged conflict.
More than 90% of Iran's international trade flows through the Strait, and the US blockade has cut off nearly 70% of the regime's export revenues. By restricting all commercial traffic traveling to or from Iran's Gulf coast, the naval action hits the country's primary economic source of income.
US Blockade of Iran’s Gulf Coast
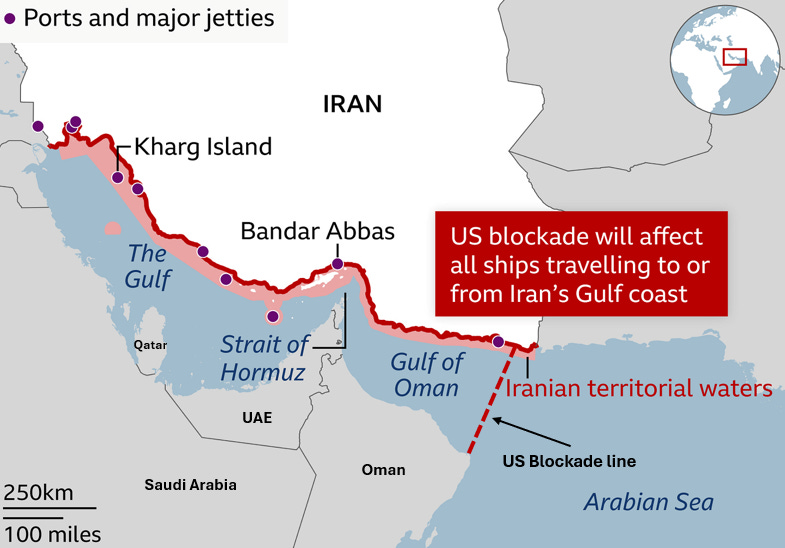
Oil & Gas sales account for 60% to 80% of total government income. This revenue streams directly into everything from military deployments to basic social services for a population of over 91M people. We believe the regime cannot maintain its current military posture without triggering domestic instability.
In our view, the loss of hard currency forces a severe budget crisis, meaning Iran cannot keep the Strait closed without accelerating its own economic collapse.
For a more detailed analysis of the US-Iran conflict and its impact on the tanker market, we published two dedicated thematic research reports on the subject.


1.1 The UAE Has Held Up Well
The UAE air defense network has intercepted most of the 500 ballistic missiles and 2,000 drones launched by Iran. Casualties remain limited and infrastructure damage is manageable. In our view, this success proves that heavy investment in military hardware has protected core economic assets.
Saudi Arabia & UAE Move Oil Through Pipelines After Attack
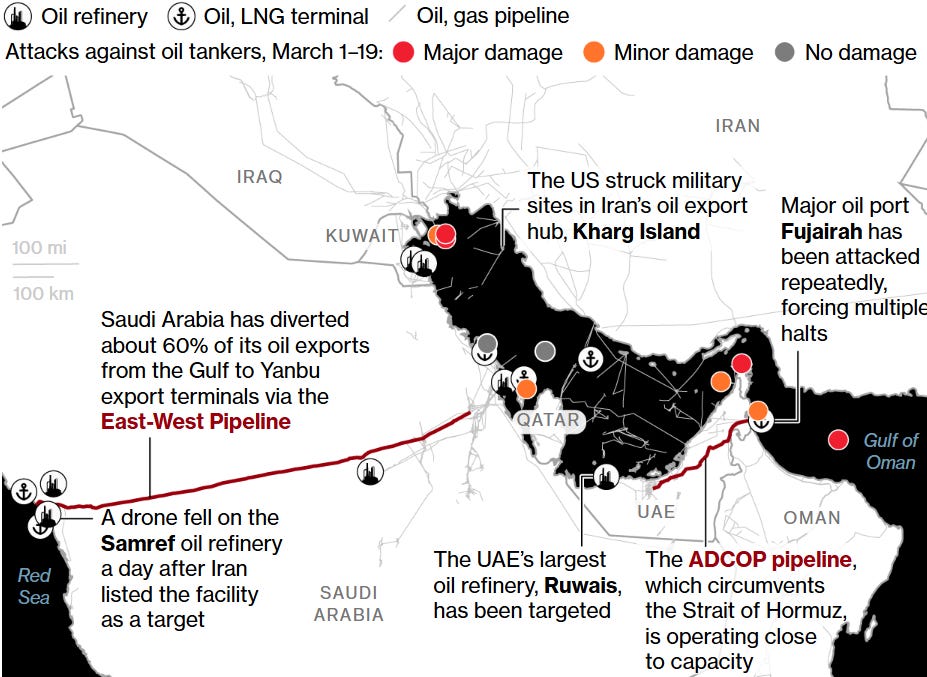
We believe this security allows the country to maintain significant oil potential. Following its exit from OPEC, the UAE holds the largest volume of unused production capacity among recent departing members.
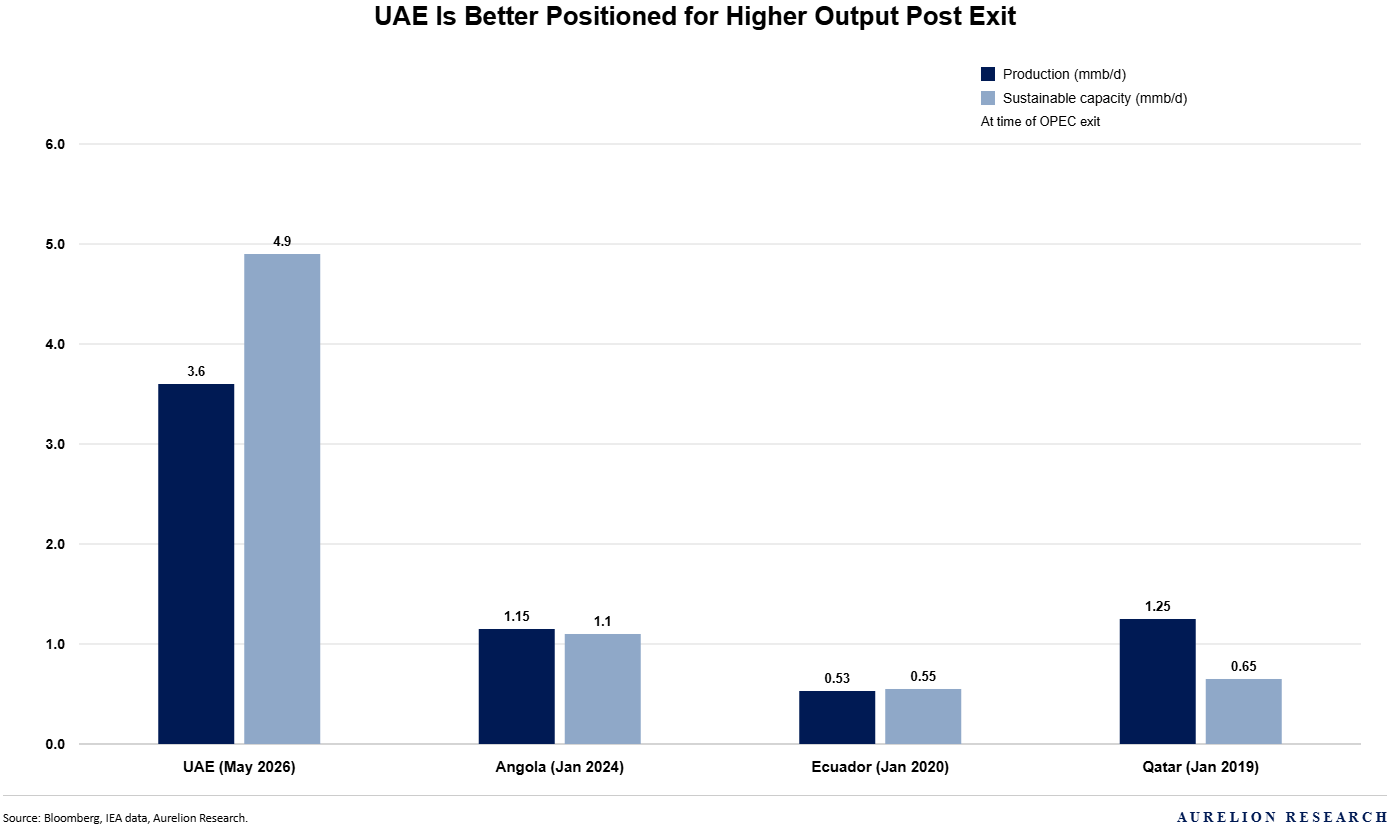
Output fell to 2.2M barrels per day during the conflict, but the country can pump close to 5M barrels per day. Pipeline logistics remain vital for bypassing naval threats. Saudi Arabia has sent 60% of its Gulf oil exports overland via the East-West Pipeline to the Red Sea port of Yanbu. Concurrently, the UAE routes crude through the ADCOP pipeline to Fujairah, avoiding the Strait entirely.
In our view, while localized drone strikes have targeted major refining complexes like Ruwais and Samref, these alternative transport routes are operating near maximum capacity, preventing a total collapse in regional export volumes.
While the Ministry of Energy states it will increase production in a gradual manner, we believe the actual return of this oil will be slow. The government will likely pace its extra volume to avoid driving prices down too quickly.
In our view, the UAE will most likely phase in this extra capacity over a full year, balancing global supply shortages against its own financial goals.
1.2 The China Narrative Does Not Hold
The idea that this conflict is primarily designed to weaken China does not reflect what is actually happening. China has continued buying Iranian oil throughout, sourcing discounted barrels through established networks, and the US threat of 25% tariffs on nations trading with Iran has not changed that behavior in any meaningful way. This conflict is about Iran’s nuclear ambitions and its broader regional influence. China is a factor in the sanctions picture, but framing the entire conflict as a move against Beijing misreads what is driving it.
1.3 The Clock Is Running
Restricting transit through the Strait of Hormuz is Iran’s main source of geopolitical leverage, but the strategy has hit a physical limit. With naval enforcement constraining tanker transit through Gulf exit routes, export throughput has collapsed significantly. Vessel-tracking data from Vortexa shows that departures fell by over 80% in late April compared to the March baseline.
Tankers Anchored in the Strait of Hormuz (April 18, 2026)

Because onshore storage facilities at Kharg Island and Sirri Island are filling rapidly, the regime has been forced to act. The U.S. Department of Energy confirmed that Iran has cut crude oil production by ~400,000 barrels per day.
We believe this infrastructure backlog severely shortens Tehran’s timeline.
While the country can distribute these cuts across multiple fields to prevent immediate, permanent damage to its reservoirs, the financial strain is immediate. In our view, these compounding economic and physical pressures will force a diplomatic resolution much sooner than the market currently expects.
2. Are Kharg Island's Oil Docks Empty?
Iran’s main oil export terminal at Kharg Island has gone quiet.
Satellite imagery from May 8, 9, and 11 shows no tankers at the facility, marking the longest stretch without activity since the conflict began. In the 73 days since attacks started on February 28, tankers were visible at the jetties on 33 days. While Iran previously loaded ships for floating storage, that activity has stopped.
Oil Slick Reported Off Kharg Island's West Coast (May 6, 2026)
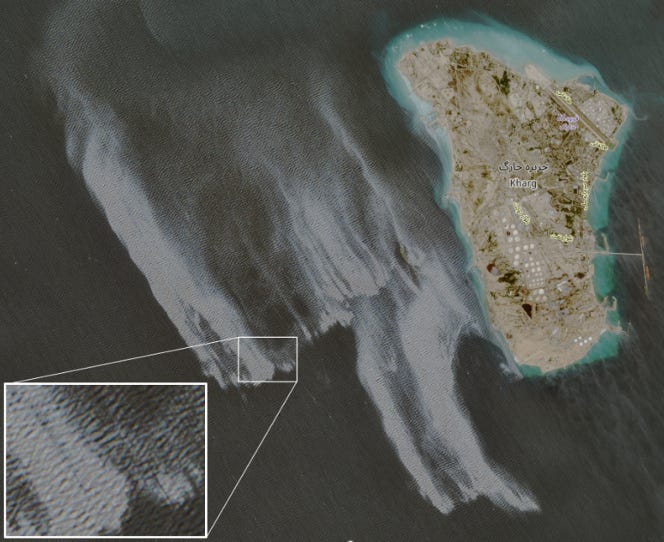
The backlog is growing quickly.
The number of tankers anchored east of Kharg Island rose from 3 on April 11 to at least 18 by May 11, with others anchored off Chabahar. These ships cannot leave the Gulf without risking seizure or attack by the US Navy.
Satellite Comparison: Kharg Island Oil Tanks (April 6 & May 11, 2026)
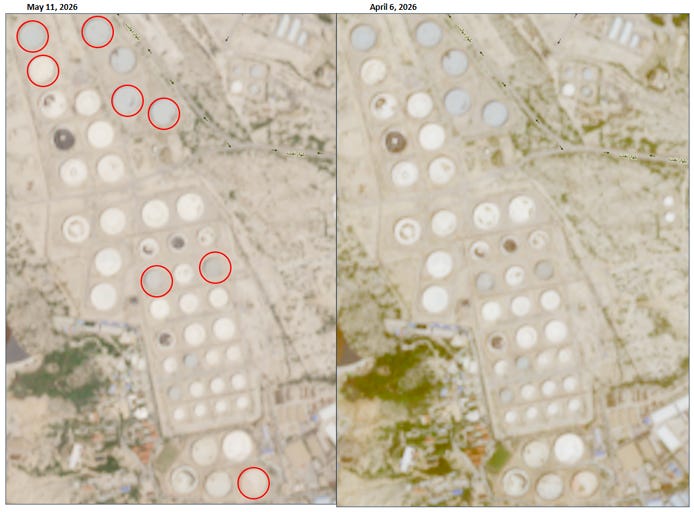
With tanker loadings paused, storage tanks on Kharg Island are filling up. Satellite analysis of tank roof shadows shows spare capacity at the facility is approaching zero. Kpler estimates Tehran can only keep pumping until late May before running out of space entirely.
Once that happens, Iran must cut production at additional fields. While political posturing continues, the financial pressure only moves in one direction. A regime that cannot sell its oil, cannot store its crude, and is watching its tanker fleet pile up inside the Gulf has a massive incentive to resolve the conflict quickly.
2.1 What it Means for Oil
For oil, this supports our view that prices will not stay elevated over the long-term. The economic pressure on Iran is building to a point where a resolution becomes more likely than the market assumes. A country that cannot export its oil, cannot store its crude, and is watching its revenue dry up does not have the luxury of holding out indefinitely. We think that reality will force movement on the Strait sooner than most expect, quickly erasing the geopolitical premium from prices.
2.2 What it Means for Shipping
For shipping, the outlook is more interesting. When the Strait reopens, a large amount of stranded oil will move at once. As routes normalize, the shadow fleet loses its premium, and compliant tankers will capture the returning volume. The longer the blockade lasts, the more significant that rebound will be for the sector.
We also published a dedicated report on April 8 covering the broader Iran War playbook, including our views on chemicals, fertilizers, and two new high conviction stock ideas we added at the time.
If you want to understand how we were thinking about the conflict from an investment perspective beyond shipping, that report is worth reading.
The Iran War Playbook: Chemicals, Fertilizers, and 2 New High‑Conviction Stocks

Between the US, Israel, and Iran, we never really run out of news. Some of it is just noise, but some of it is incredibly relevant. As analysts, our job is to filter out the distractions and focus on the stories that actually impact our investment thesis or reveal new trends that we can benefit from.
3. Inside One of North America’s Largest Ports
We always like to prioritize on-the-ground research whenever possible. Whether it involves visiting retail storefronts or sampling every flavor of a new consumer brand, we prefer real-world data over desk analysis.
Shipping demanded a more comprehensive field study, and frankly, it was far more engaging. We spent time at the Port of Montréal in Québec (Canada), a major North American gateway and the home base for Aurelion Research.
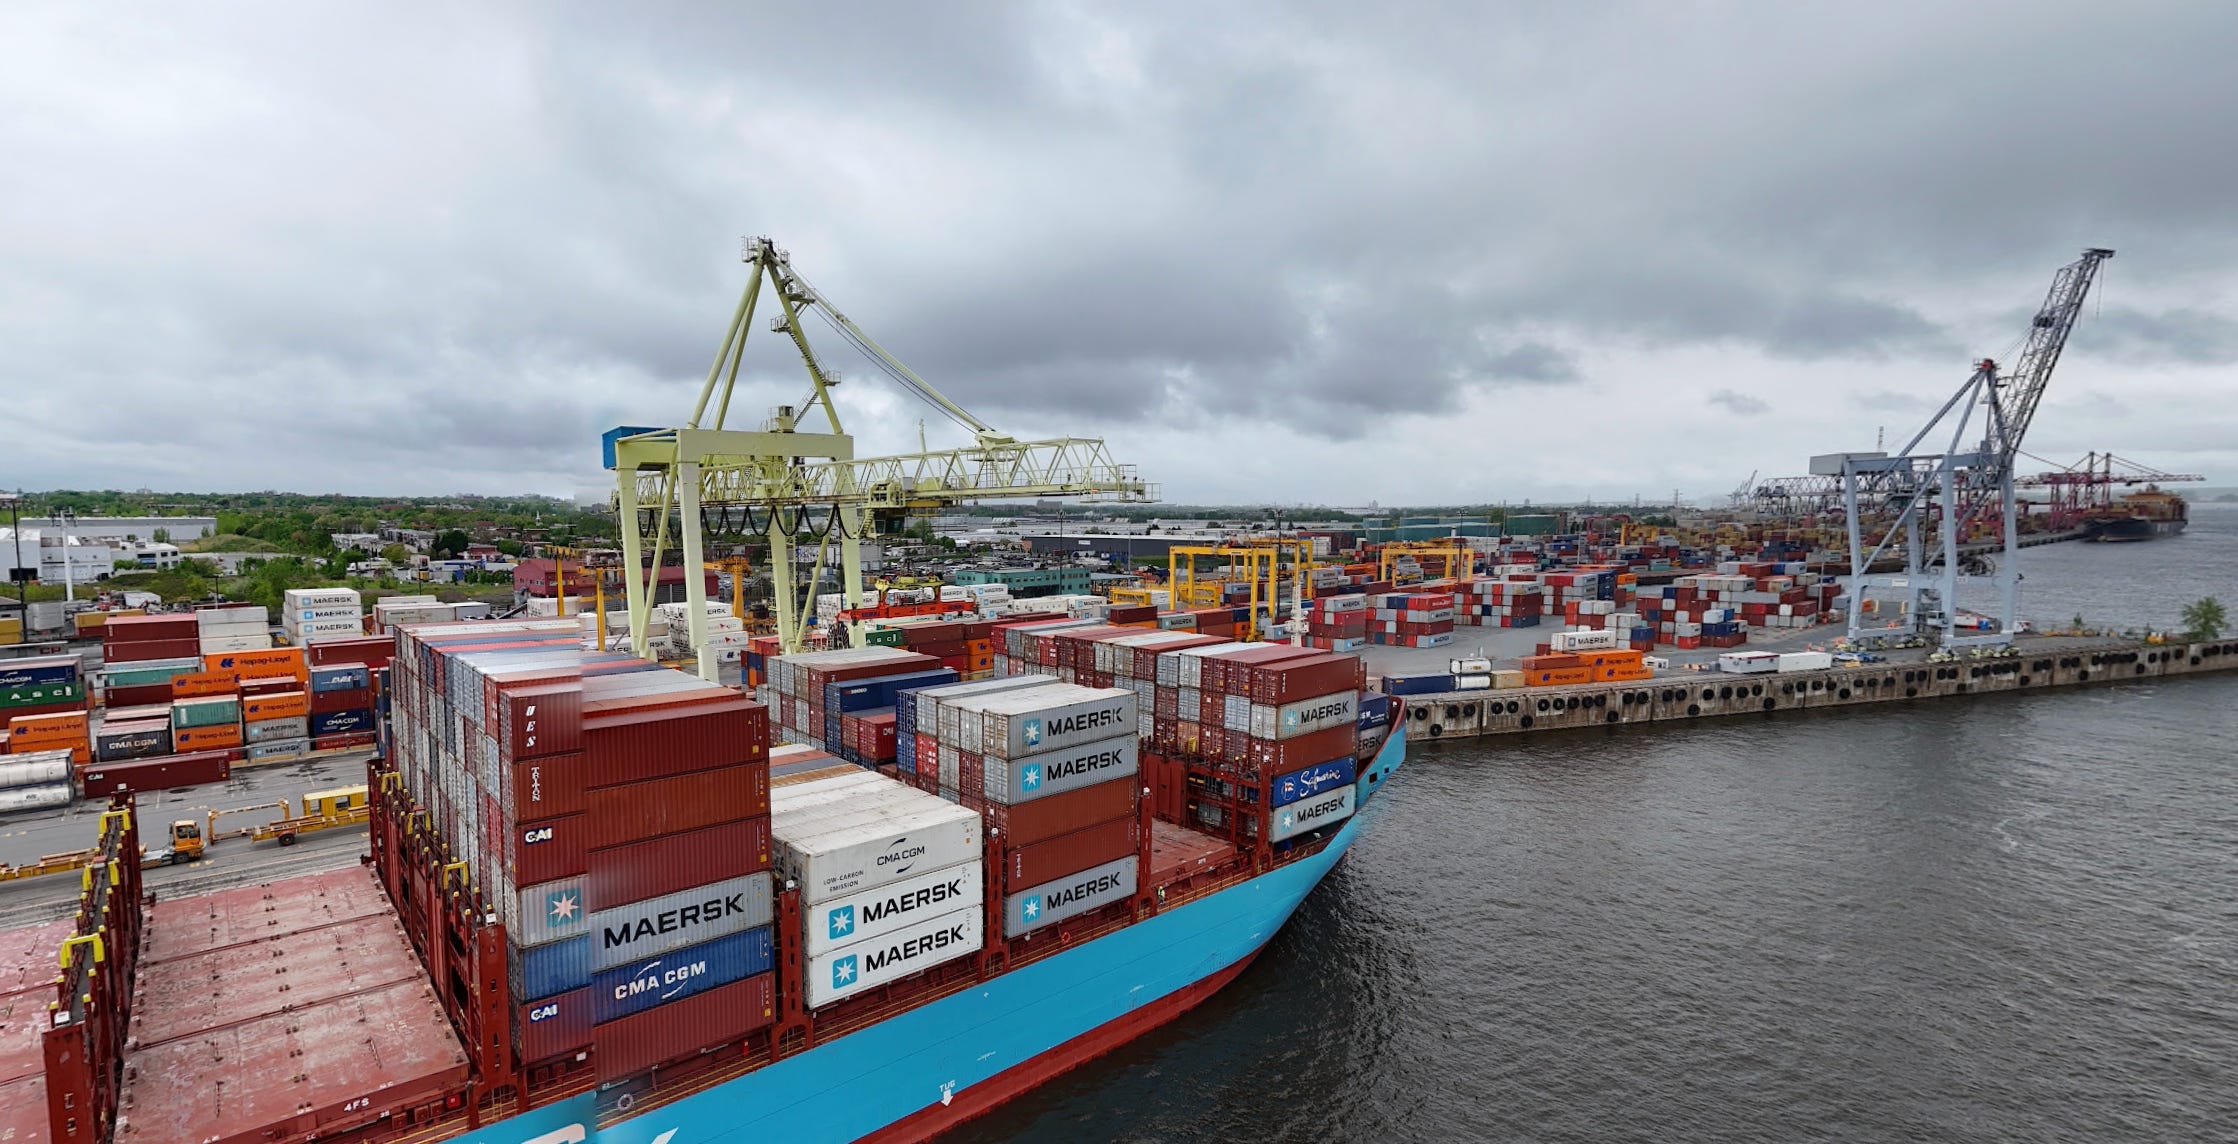
As the largest container port in Eastern Canada, it handles massive volumes of dry bulk, liquid bulk, and containerized freight. Because its daily operations touch almost every key segment of maritime logistics, it offers a clear look at how global trade works and the broader challenges facing the market, which is exactly why we wanted to visit it firsthand.
Cape Redirection & Schedule Breakdown
Talking with port operators highlighted how deeply global logistics are shifting. Ongoing conflict in the Middle East and disruptions at vital choke points like Bab el Mandeb and the Strait of Hormuz have upended global shipping schedules.
Most container vessels moving from Asia to Europe or the North American East Coast now bypass the Suez Canal entirely, routing instead around Africa’s Cape of Good Hope. This detour adds ten to fourteen days of sailing time to a standard round trip, which ties up global ship capacity and pushes container freight rates higher worldwide. For the Port of Montréal, the breakdown of predictable weekly arrival schedules creates severe operational challenges. Terminals experience days of unnatural quiet followed by a sudden, heavy bunching of vessels. This uneven flow strains dock labor and terminal yard capacity, forcing rail operators like CN and CPKC to constantly adjust their freight handling on the fly.
Crude Volatility & Shipping Costs
Port workers also emphasized that with oil prices frequently crossing $100 a barrel this year due to tensions in the Persian Gulf, the cost of marine fuels like VLSFO and HSFO has surged. Shifting to longer routes around Africa on top of these high prices means daily running costs for shipping lines are skyrocketing. To protect their margins, companies are strictly enforcing emergency fuel surcharges and telling their ships to slow down to save fuel.
The Shift to Smarter Routing
The constant supply chain shocks of the last few years have forced managers to give up old, “just-in-time” delivery models that left no room for error. Companies no longer want to rely on a single path for their goods. Instead, they are spreading their freight across different coasts and ports. This helps them avoid getting stuck if one location faces problems, whether those problems are caused by politics, strikes, or low water levels, like we have seen in the Panama Canal.
Linking Ocean Alliances to Local Rail
We took these photos during our visit, showing Maersk and Hapag Lloyd containers loaded onto train cars right next to the docks. Seeing these two brands side by side highlights a major trend in global shipping. These companies operate under a massive partnership called the Gemini Cooperation, which was created to keep shipping schedules tightly managed and reliable.
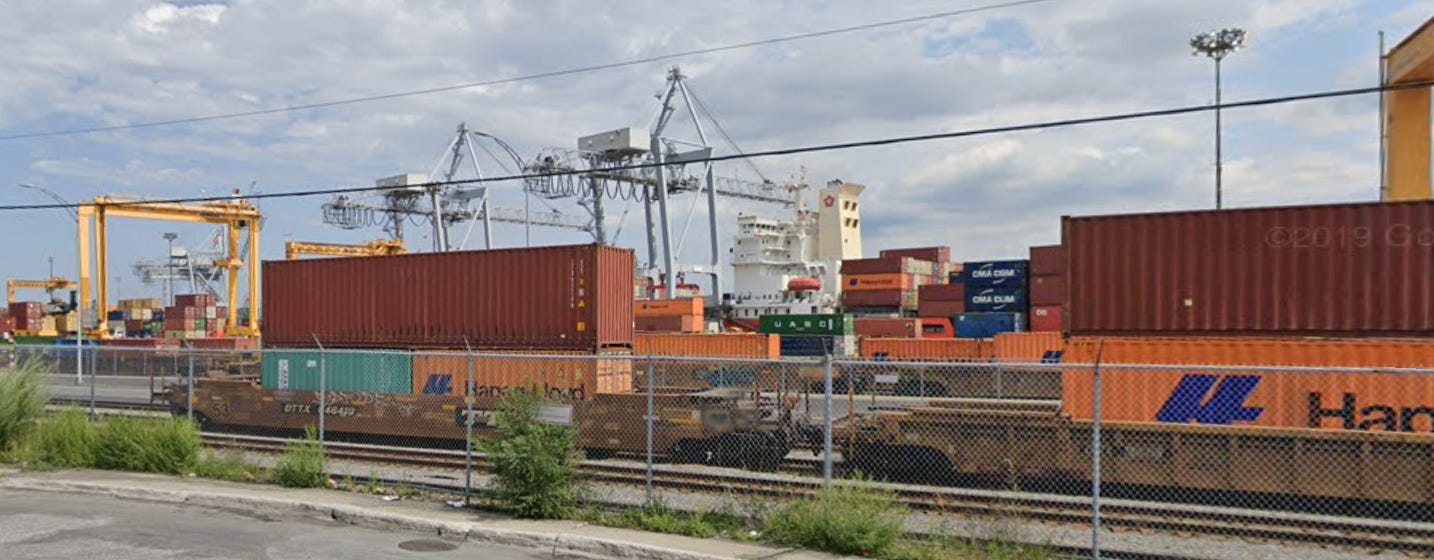
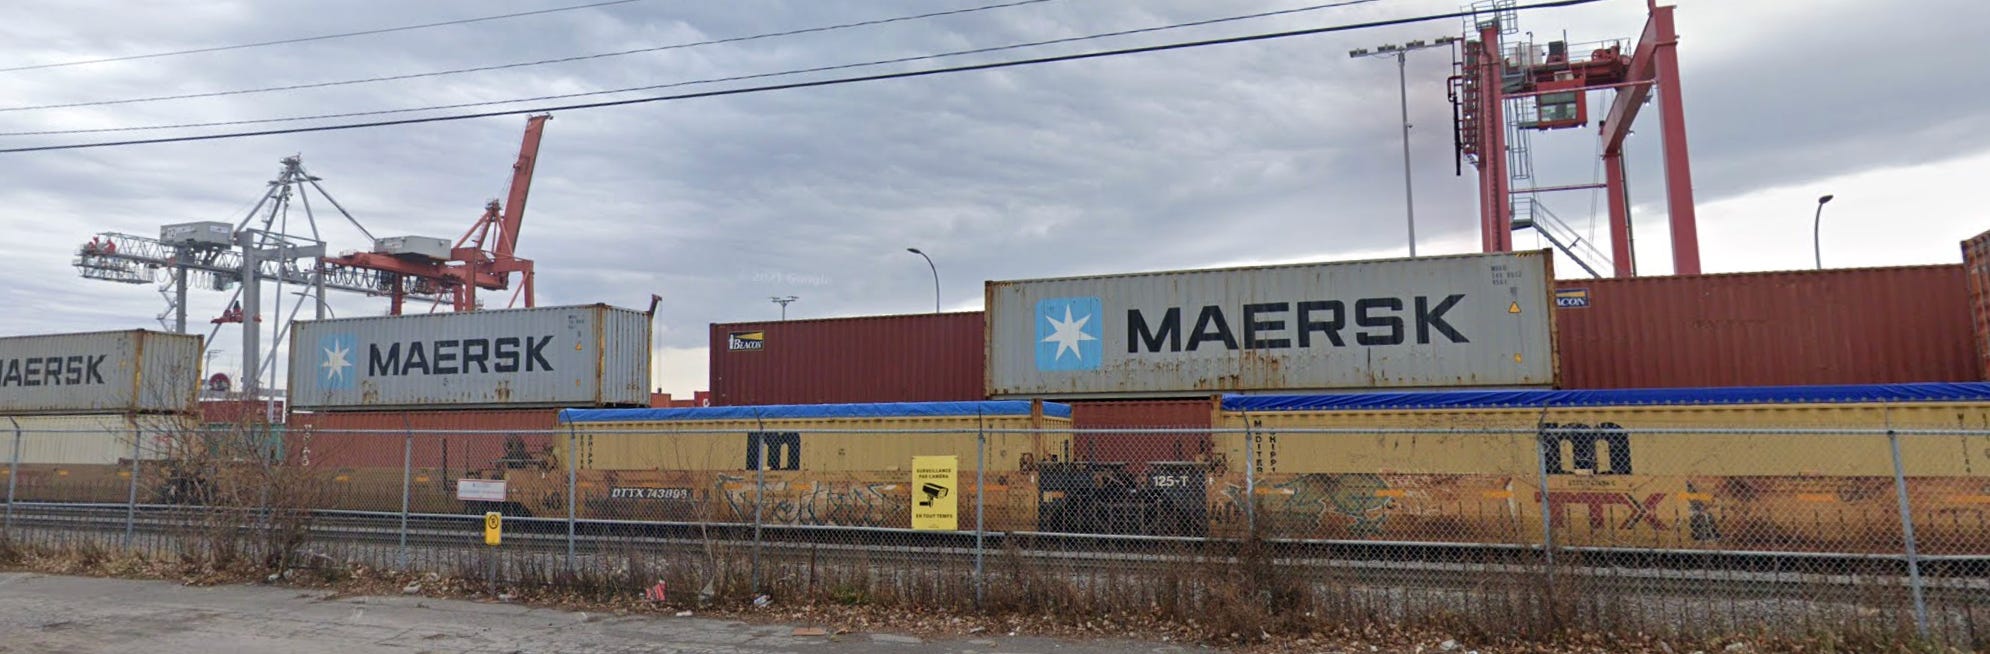
When global tensions force ships to take the long route around Africa, those strict schedules fall apart. When delayed ships finally arrive at the port all at once, it puts immediate pressure on the tracks and rail cars shown here. It is a great example of how ocean delays quickly become land problems, forcing local rail systems to quickly adjust to handle the sudden flood of cargo.
4. The Main Segments of the Shipping Industry
The shipping industry comprises several distinct segments, each driven by its own unique supply and demand dynamics.
While some sectors provide predictable cash flows tied to long term contracts, others experience high volatility and depend entirely on fluctuating daily spot rates. Examining these individual sectors shows how different fleets operate and why certain segments are better positioned to handle shifts in global trade.
4.1 Dry Bulk Shipping
This segment handles the transport of raw, unpackaged commodities.
The market splits these goods into major bulks like iron ore, coal, and grain, and minor bulks like fertilizers, steel, and construction materials. Trade flows typically move from large producing regions in Australia, Brazil, and North America to major consumption hubs in China, Japan, and Europe. To handle these diverse cargoes, the global fleet varies significantly in size.
Handysize vessels are smaller, versatile ships that typically carry between 15,000 and 35,000 DWT. Because they have their own onboard cranes, they can operate in smaller ports or shallow rivers without loading infrastructure. This flexibility makes them the standard choice for regional trade and minor bulk commodities.
Capesize vessels sit at the largest end of the bulk carrier segment, usually carrying 150,000 DWT or more. They get their name because their size historically forced them to sail around Cape Horn or the Cape of Good Hope instead of using major canals. These ships do not have onboard loading gear and rely entirely on deepwater terminals to load and unload cargo. They primarily transport long-haul iron ore and coal.
4.2 Tanker Shipping
Tankers transport liquid cargo, focusing primarily on crude oil and refined petroleum products like gasoline, diesel, and jet fuel.
The segment also includes specialized vessels for chemicals and liquefied natural gas (LNG). To maintain operational efficiency, most tankers specialize exclusively in a single cargo type rather than switching between different liquids.
In the crude oil market, the industry relies heavily on Very Large Crude Carriers (VLCCs) to transport unrefined oil from major production regions to global refining centers. Product tankers serve the clean segment of the market, moving refined fuels from those refineries to international consumer markets. LNG carriers represent a growing share of the global fleet as the international trade of natural gas continues to expand.
To monitor the health and pricing dynamics of these segments, the industry tracks two core benchmarks. The Baltic Dirty Index (BDTI) measures the spot market strength for raw crude transportation, while the Baltic Clean Index (BCTI) tracks the rate environment for refined products.
4.3 Container Shipping
Container shipping moves manufactured and finished goods from factories to consumer markets. Everything from electronics to clothing is packed into standard steel containers and loaded onto vessels that run on fixed, predictable liner schedules, much like commercial airlines.
The busiest trade lanes connect manufacturing hubs in Asia to major consumer markets in North America and Europe. While ocean carriers historically focused just on moving cargo from port to port, the industry has increasingly shifted toward integrated logistics, with many lines now handling the inland journey all the way to the final warehouse.
Freight rates in this segment split between long term annual contracts and the immediate spot market. To monitor pricing trends and capacity demand, the industry relies heavily on benchmarks like the China Containerized Freight Index (CCFI), which tracks rate fluctuations across major global export routes.
4.4 Specialized Segments
Beyond the main bulk and container markets, several specialized segments rely on vessels designed for specific operational roles. These markets are driven by distinct economic factors and trade flows rather than standard freight cycles.
Offshore Vessels provide critical support to the marine energy sector. This segment includes a range of specialized assets such as deepwater drilling rigs, subsea construction platforms, and support vessels that transport crews and supplies to offshore fields. While historically tied to oil and gas, these assets are increasingly used in offshore wind and renewable energy projects.
Car Carriers are specialized vessels serving the global automotive industry. These include Pure Car and Truck Carriers (PCTCs) and Roll-on/Roll-off (Ro-Ro) ships, designed with multi-deck structures to transport finished vehicles efficiently from manufacturing hubs to consumer markets. The segment requires flexibility to handle shifting export flows and the growing share of electric vehicles.
Cruise Ships differ from cargo vessels as they transport passengers rather than goods. These ships operate as floating resorts, where onboard services and the travel experience are the primary commercial product. Demand is driven by leisure spending, seasonality, and route selection.
Ferries are key components of regional transport networks, particularly in coastal and island regions. Operating over short, fixed routes, they carry both passengers and freight, providing essential links where land is limited or unavailable.
5. What We Learned From Speaking With Shipping Executives
When you do a Primer on an industry, even if you know the space well, speaking with experts, management teams, owners, and analysts is always one of the best ways to get direct, on the ground insights on what is actually happening and what the people who work in the industry see every day.
That is exactly what we did for this shipping Primer.
We spoke with DHT CEO Svein Moxnes Harfjeld and NAT CFO Bjørn Giæver, two experienced operators who have been in this business for a long time and know it inside out. We will not quote them directly, but we will share the most important things they told us, in our own words.
5.1 Svein Moxnes Harfjeld, CEO of DHT
One of the first things that stood out to us about DHT Holdings is how seriously they think about the long-term sustainability of their business.
They engaged leading energy research firms to understand where oil demand is heading over the next few decades, asking hard questions about which technologies could realistically displace oil and at what cost.
In the tanker business, you are ordering ships that will be on the water for decades. If the demand picture changes materially, the economics of those assets change with it. Studying that question before committing capital is a rational and necessary step for any operator thinking beyond the next few years.
Their conclusion is that peak oil demand is likely to occur sometime in the mid-2030s, followed by a plateau of roughly a decade before any meaningful decline begins. That view directly shapes how they think about vessel investments.
They calculate the time charter equivalent earnings required to generate a 10% return on capital employed and compare that to historical earnings adjusted for fuel efficiency improvements. They only move forward when there is a clear gap between those two numbers. Simple, but disciplined.
On risk, DHT ranked global GDP and geopolitics as the two most important threats to their business, in that order. We think that is the right way to look at it.
The two are deeply connected. Geopolitical instability weighs on economic growth, and a weak global economy can itself create the conditions for conflict. For a business that depends on the volume of oil moving around the world, both factors hit in the same direction.
On capital allocation, DHT thinks the way we do. Models and frameworks are useful, but running a business well requires judgment and the confidence to act on experience when the numbers alone do not give you a clear answer.
We believe that is when management quality really makes the difference, and why the trust an investor places in a management team is so important over time.
Finally, DHT has a clean governance structure, and in shipping, that is worth highlighting. All services required to run the company are handled by people employed directly by DHT. No privately owned companies billing the public entity, no conflicts of interest. The board is independent, management are shareholders, and they act like it. That is not always the case in this industry.
That is what they told us, and it is something we also heard often from other shipping experts and industry participants we spoke with.
5.2 Bjørn Giæver, CFO of NAT
When we spoke with management, our first question focused on their strict commitment to a single asset class. Unlike competitors that diversify, NAT operates Suezmax tankers exclusively. This pure-play approach delivers distinct operational and commercial advantages, and we agree with their strategy.
From an investor perspective, a pure play fleet makes the company easier to understand and the equity story easier to communicate. There is no ambiguity about what you own when you buy Nordic American Tankers (NAT) shares, and you know exactly what kind of dividend policy comes with it. That consistency is a big part of why NAT's founder and CEO Herbjorn Hansson has earned the nickname the King of Dividends on Wall Street.
From an operational perspective, running a uniform fleet simplifies everything. Daily operations, maintenance, procurement, crewing, and scheduling all become more efficient when every ship in the fleet is essentially the same, and that translates directly into lower costs. The Suezmax carries ~1M barrels of oil per voyage, making it the second largest class of crude tanker behind the VLCC which carries ~2M. They think the size of a Suezmax sits in a sweet spot. Large enough to offer real economies of scale for oil companies and traders, but small enough to access a much wider range of ports than a VLCC can.
Many ports have restrictions on ship dimensions and storage capacity, and a Suezmax gets into places a VLCC simply cannot, giving traders more flexibility in where they can deliver their cargo. In the fast-moving geopolitical environment of the last few years, that versatility has proven particularly valuable.
On the demand side, NAT is more bullish on the long term than DHT. Their thinking is grounded in demographics. Around 100M people per year have been moving out of poverty and into the middle class over the last decade, mostly in developing Asia. When a country's demographic profile shifts in that way, energy consumption rises rapidly. They see that trend continuing, and they believe it supports sustained demand for oil transportation over the years ahead.
On supply, the new ship order book has been relatively quiet for several years, which should gradually shift the market balance in shipowners favor. That process has taken longer than expected, and the main reason is the shadow fleet.
On capital structure, NAT's philosophy is simple. The tanker business is highly cyclical and capital intensive. The biggest mistake a shipping company can make is to take the profits from a good cycle and pour them back into ships at peak prices, acquire competitors with high leverage, or buy back shares at inflated valuations. Many have done exactly that and ended up in financial difficulty when rates fell. NAT made a deliberate choice to avoid that from the start.
NAT made an early decision to return excess cash to shareholders through dividends rather than reinvest it at peak cycle prices. Those dividends vary significantly with the cycle, but shareholders who have held since the original listing have received over $50 per share in cumulative cash dividends.
Their view is that paying out excess cash creates discipline within management. Keeping too much money inside the company tends to lead to poor decisions.
6. 2026 Outlook for Shipping Market
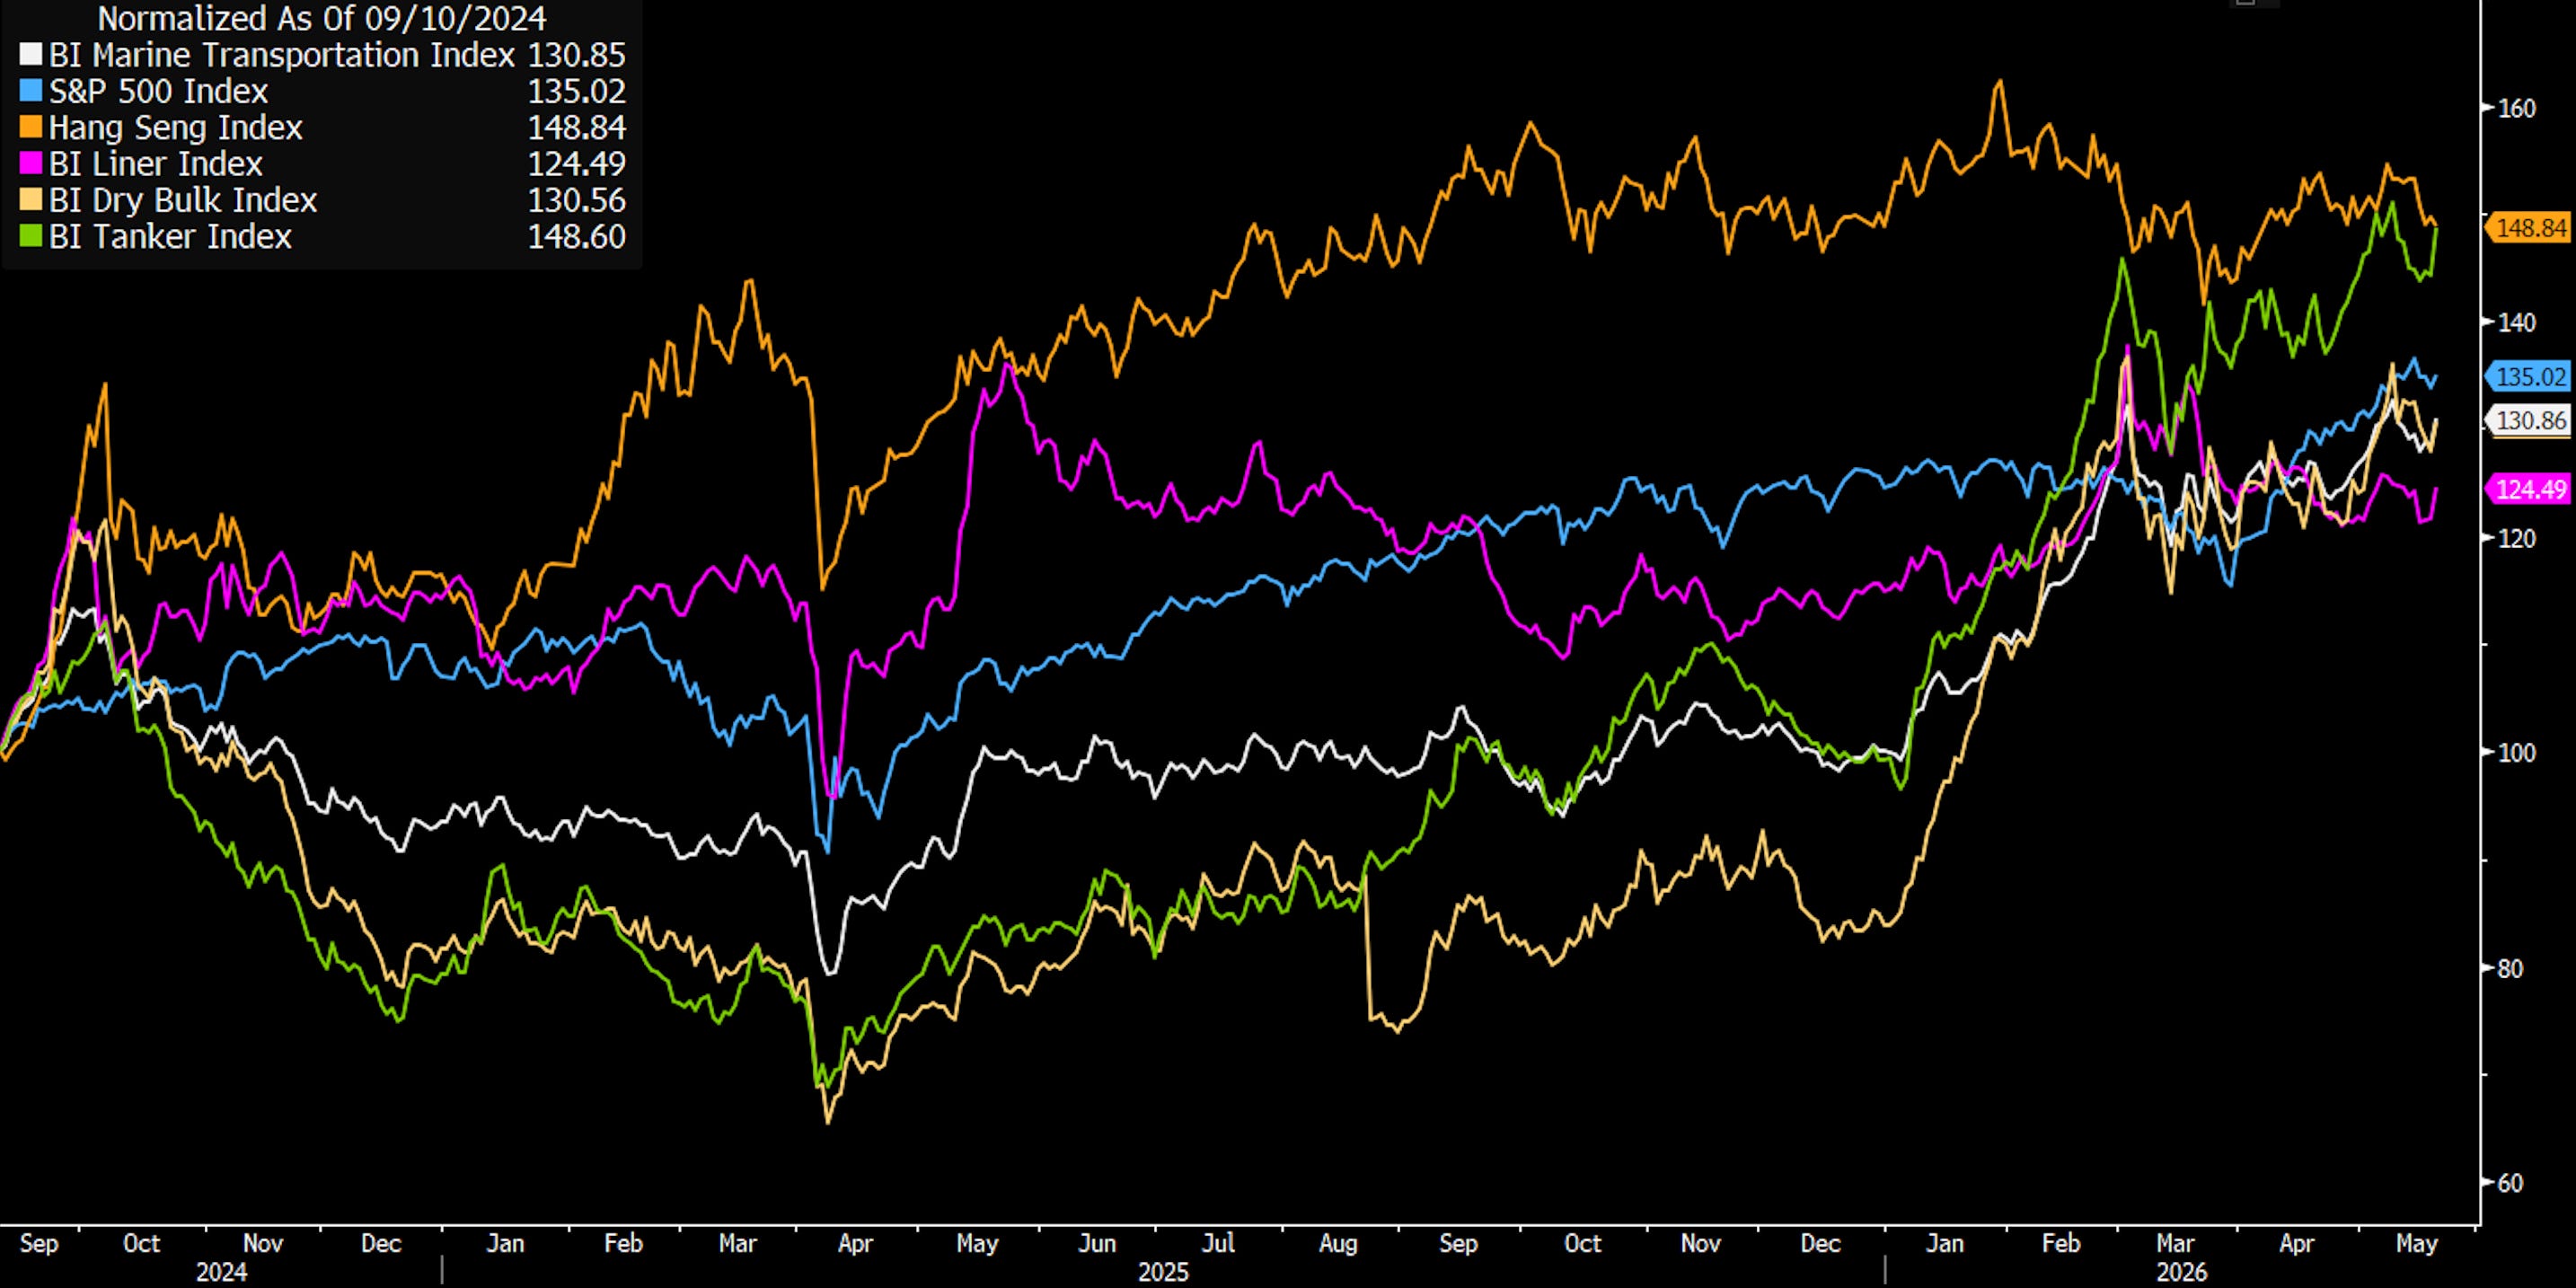
The global shipping market entered an upcycle in 2026, driven by geopolitical realignments and tight supply and demand dynamics. Maritime equities rose, with the BI Global Marine Shipping Peer Group gaining 31% year to date, outperforming broader benchmarks like the S&P 500 and the Hang Seng Index.
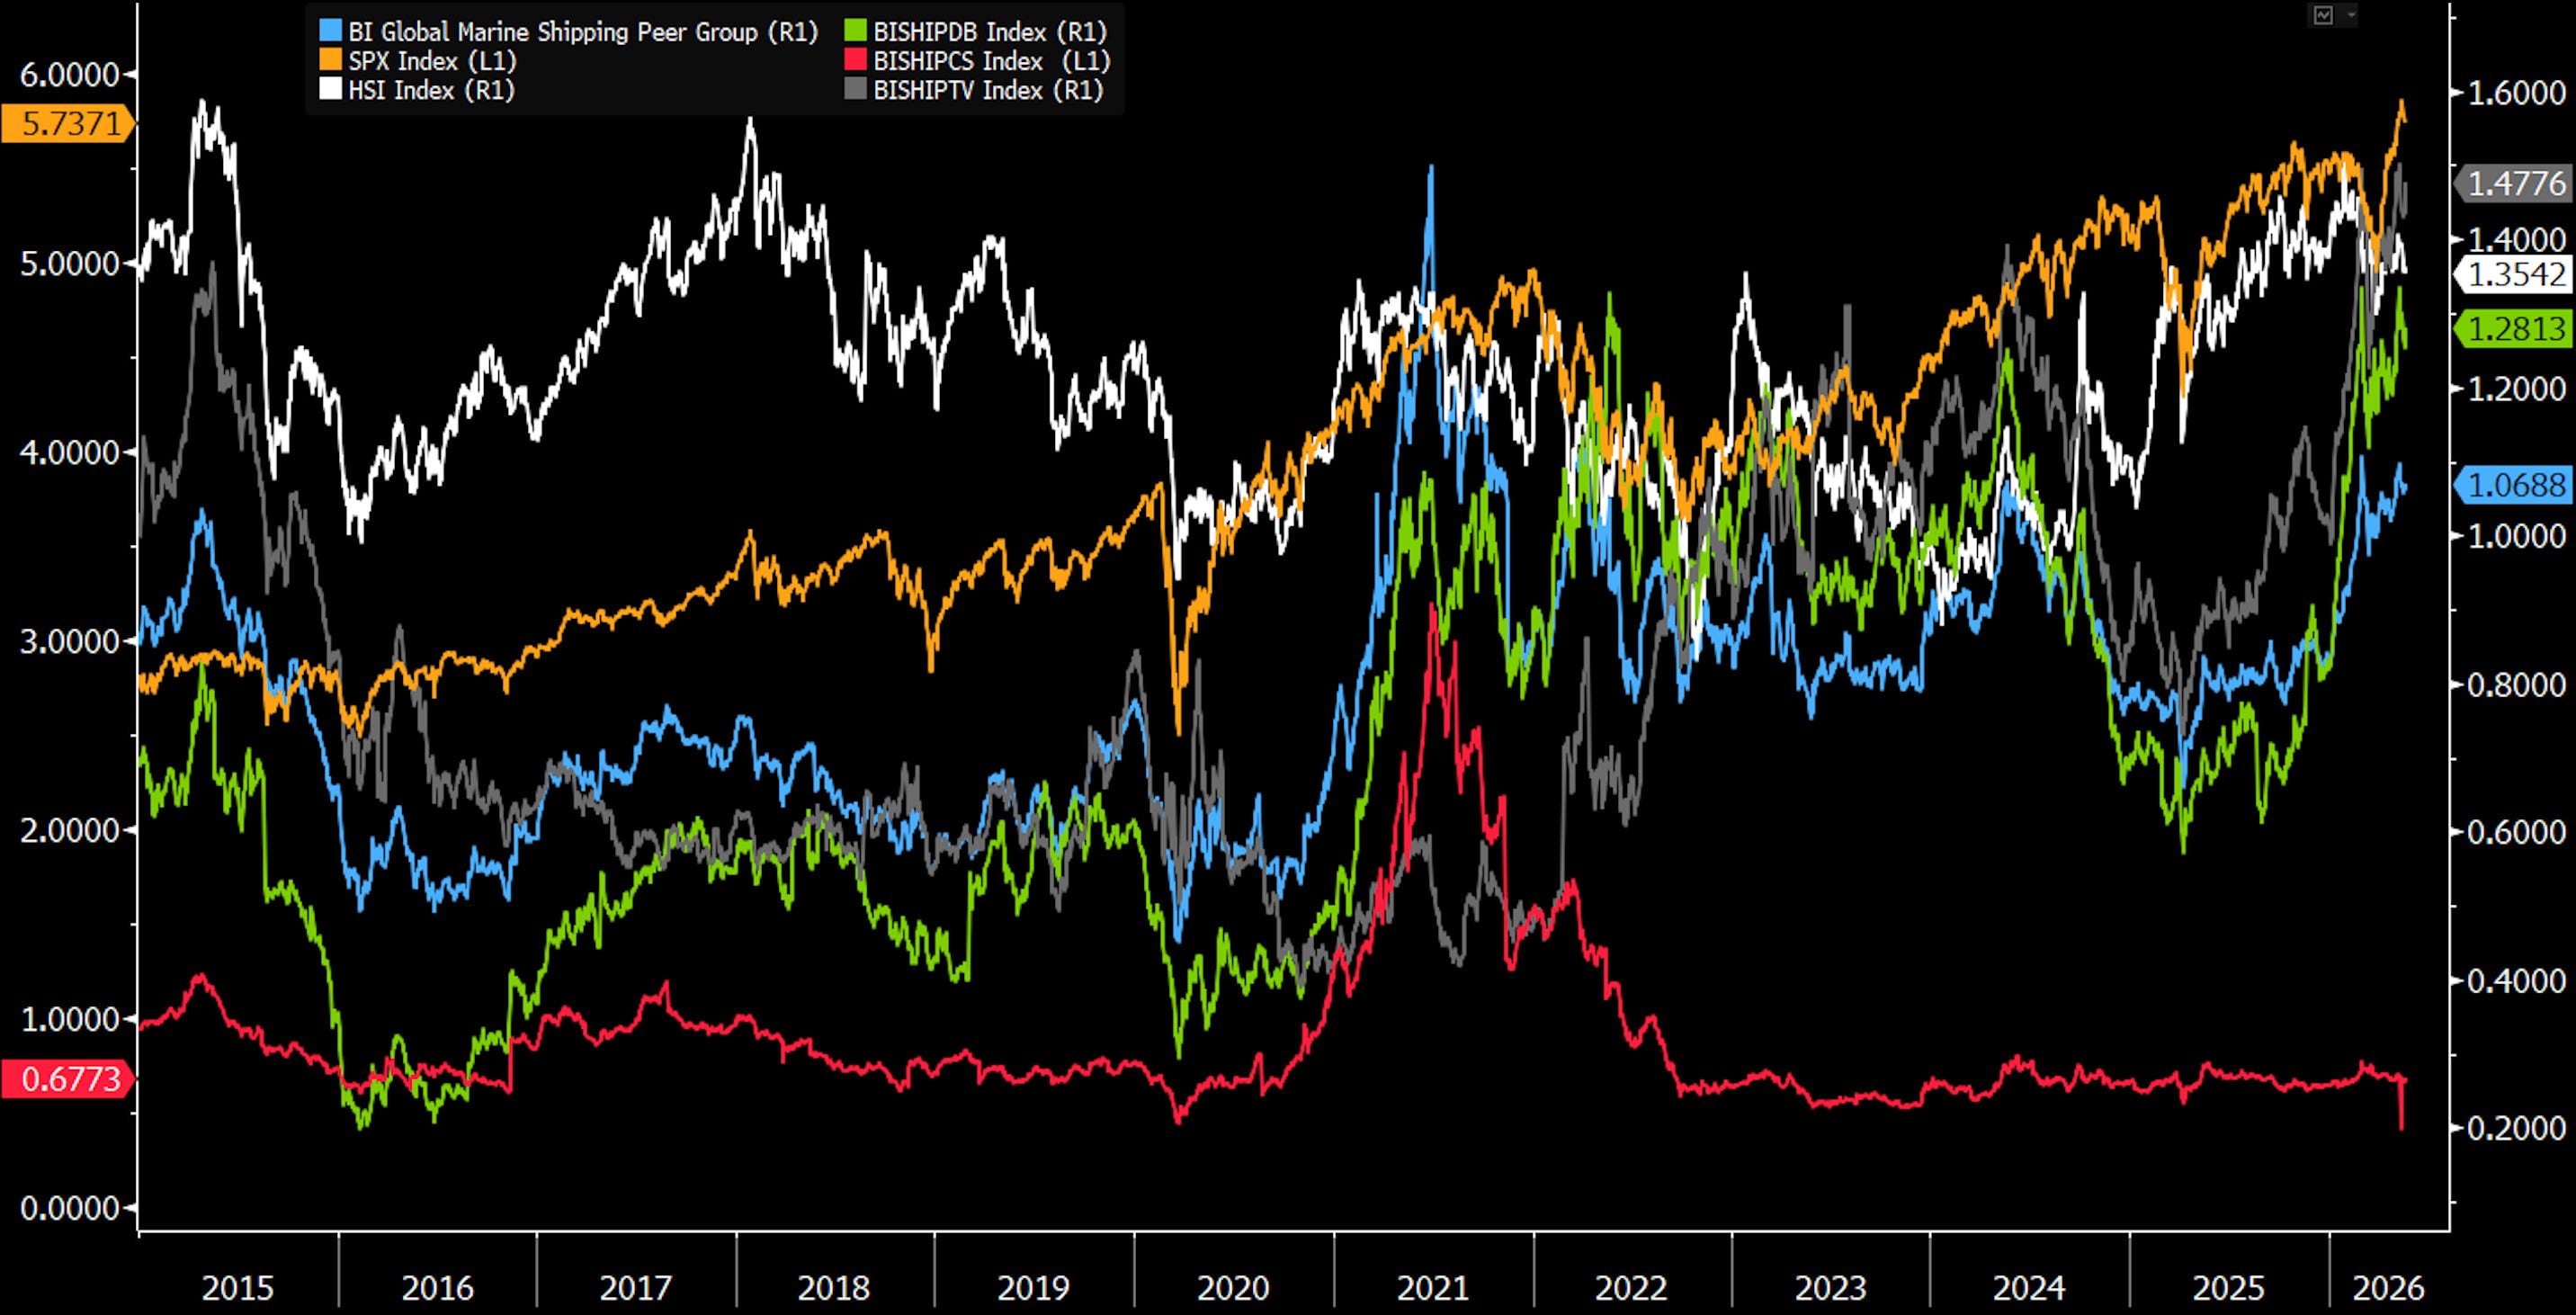
Bloomberg sector tracking shows a divergence within the industry, as the surge is led by the BI Tanker and BI Dry Bulk indices while the BI Liner Index continues to lag. In our view, this performance gap indicates that current market drivers are specific to commodity transport and route dislocations rather than a recovery in global containerized trade. Consequently, viewing the shipping industry as a single market hides the actual trend. Earnings growth and rising asset values remain concentrated within the tanker and dry bulk fleets.
The Hormuz Disruption & Route Redrawing
The main catalyst altering global trade patterns is the March 2026 closure of the Strait of Hormuz due to the war on Iran. Displacing a flow of 15M barrels of crude oil per day from the Persian Gulf forced a reorganization of international oil logistics. High income and security sensitive Asian buyers face the most exposure to this disruption. Data from Poten and Partners highlights that Japan relies on the Middle East for 95% of its crude imports, South Korea for 72%, and Taiwan for 70%. Smaller regional importers like Pakistan, the Philippines, and Sri Lanka source nearly 100% of their crude from the Gulf.
To replace these volumes, these nations are turning to the Atlantic Basin, sourcing crude from the US Gulf, Brazil, Guyana, West Africa, and Canada. This pivot introduces two challenges for the market. First, sourcing crude from across the Atlantic lengthens transit distances, multiplying ton mile demand and locking up a large portion of the global VLCC and Suezmax fleets.
Second, an operational mismatch occurs at the refinery level because many Asian refining systems, particularly in Japan, are optimized for heavier, sour Middle Eastern grades. Substituting these with light, sweet Atlantic shale or basin crudes creates inefficiencies.
While Middle Eastern exporters are expanding bypass infrastructure, including Saudi Arabia’s Yanbu pipelines on the Red Sea and the UAE’s West East pipeline to Fujairah, these projects face scaling constraints. The UAE expansion targets a 2027 completion to double export capacity, meaning incremental barrels of crude will still travel the long route around Africa in the near term, supporting a higher baseline for long haul tanker rates.
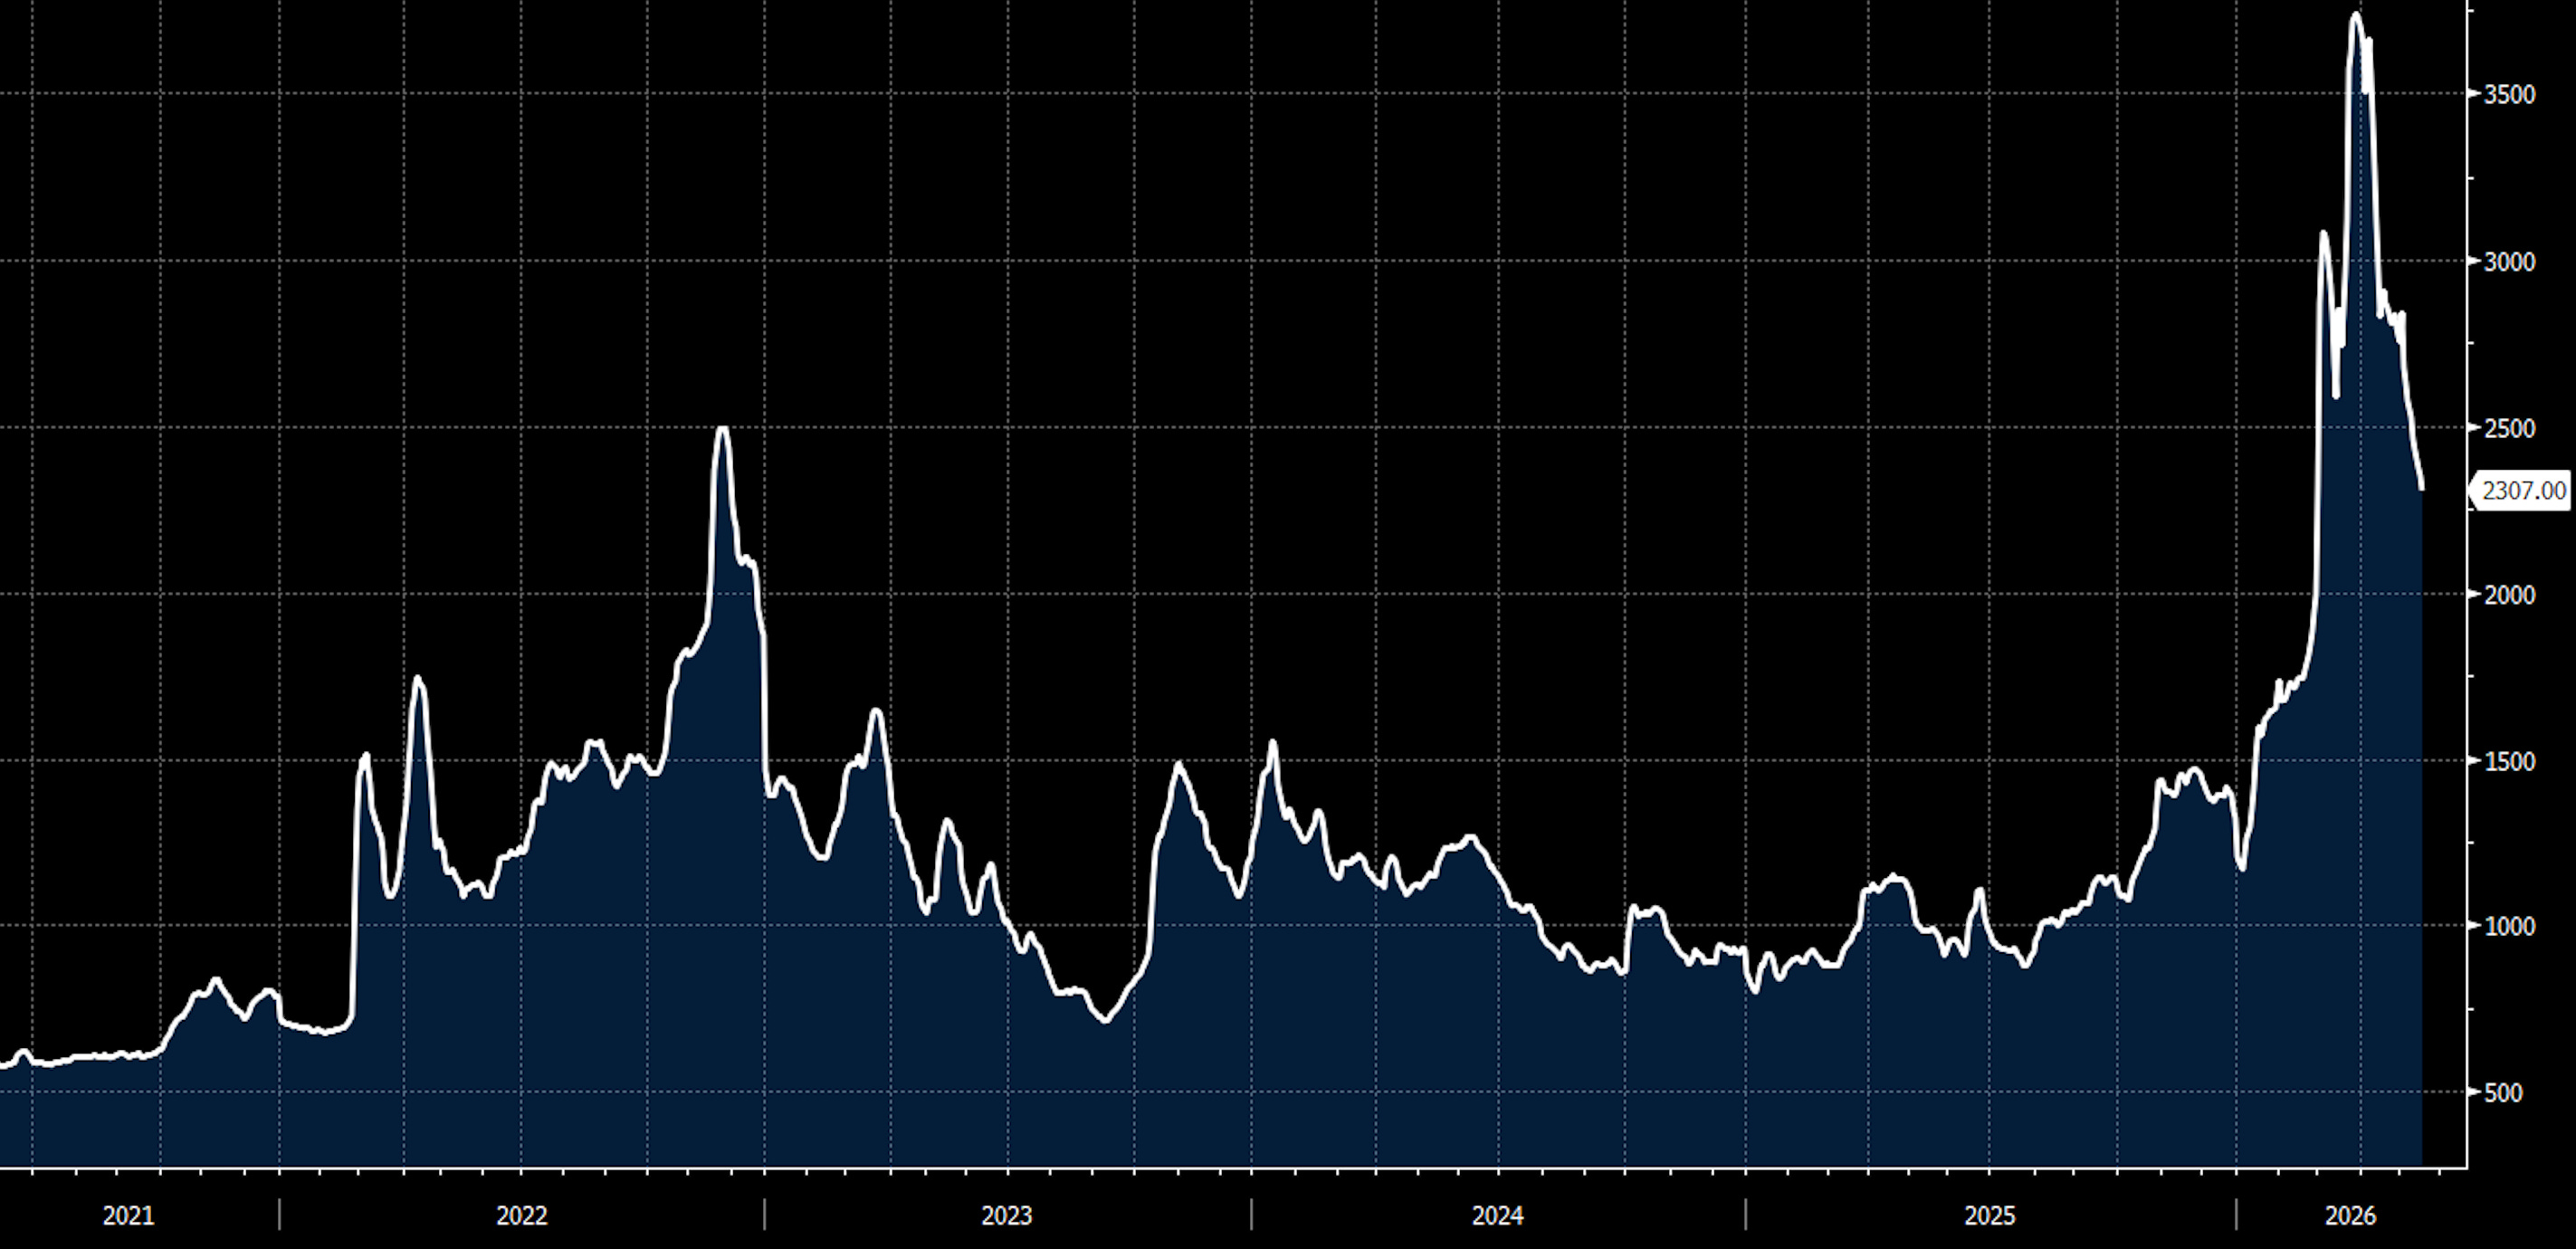
Spot Market Momentum & Rate Dynamics
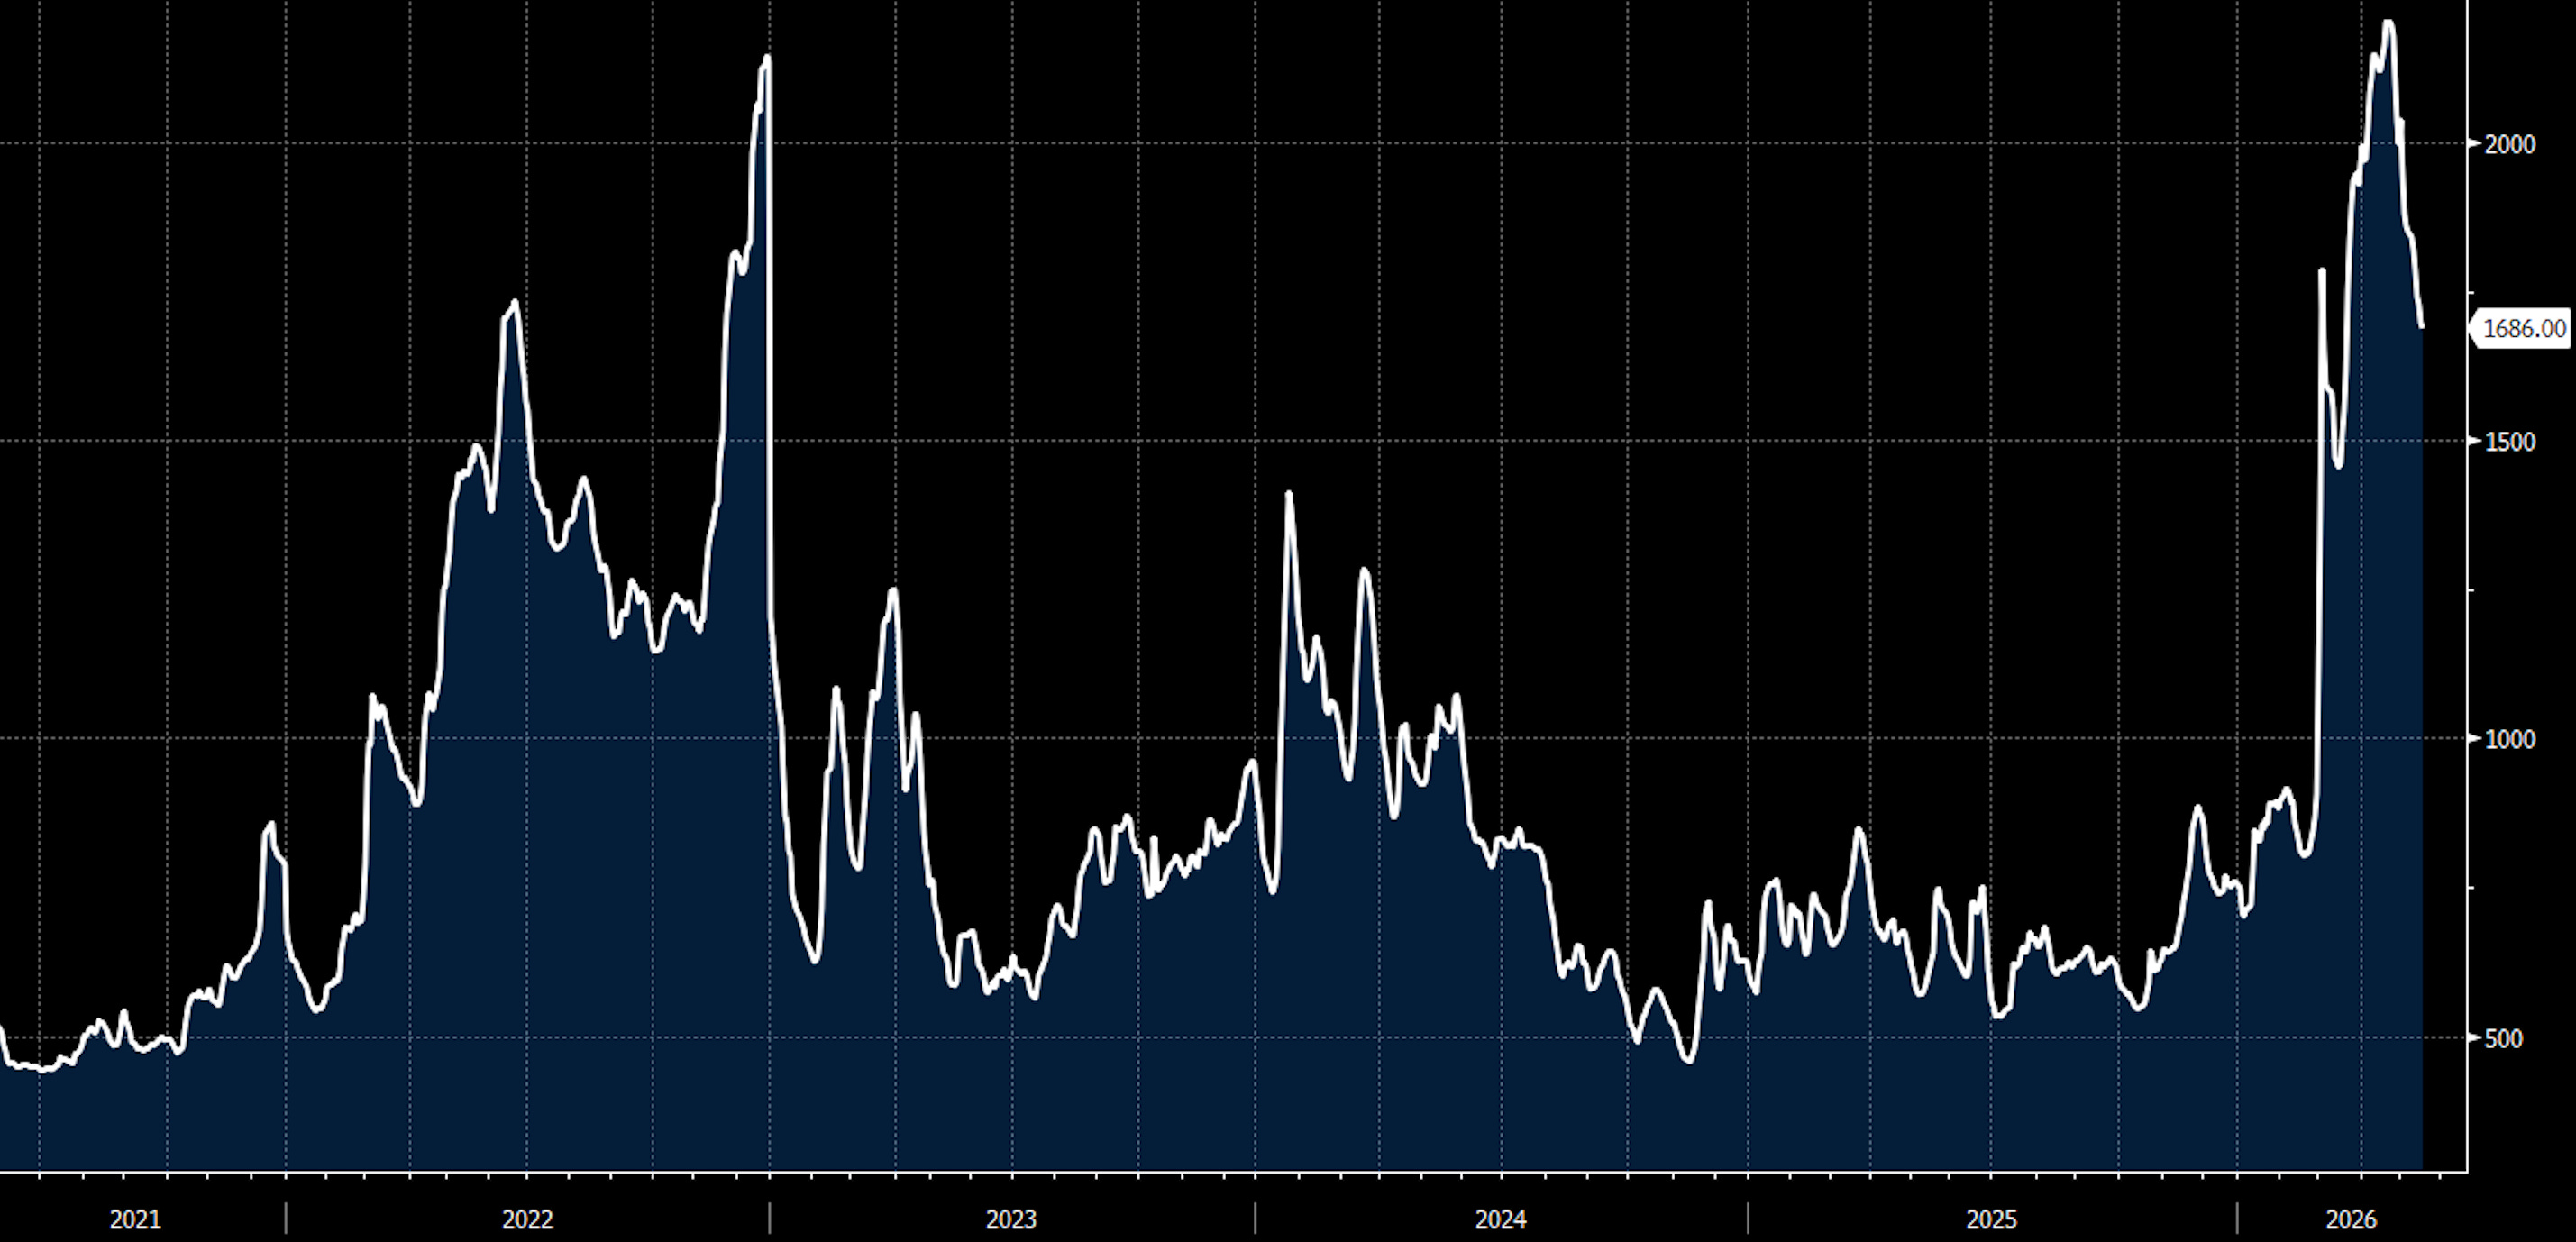
The supply shock dislocated freight pricing during the first quarter of 2026. This shift affected both unrefined and refined asset classes, lifting the Dirty Tanker Index (BIDY) to 2,307 and the Clean Tanker Index (BITY) to 1,686. Both benchmarks reached multiyear highs, reflecting the premium placed on immediate vessel availability as the fleet adjusted to longer voyages.
Bloomberg Dirty Tanker Index (BIDY)
Bloomberg Clean Tanker Index (BITY)
In the spot market, daily earnings for modern two stroke tankers surged to nearly $280,000 per day between weeks 9 and 11. For context, rates during the same period in 2025 averaged below $25,000 per day, while the five year opening quarter average sits near $50,000 per day. We believe this spread highlights the operating leverage inherent in the sector when fleet capacity tightens.
Spot Market Momentum Expected to Extend Through 2026
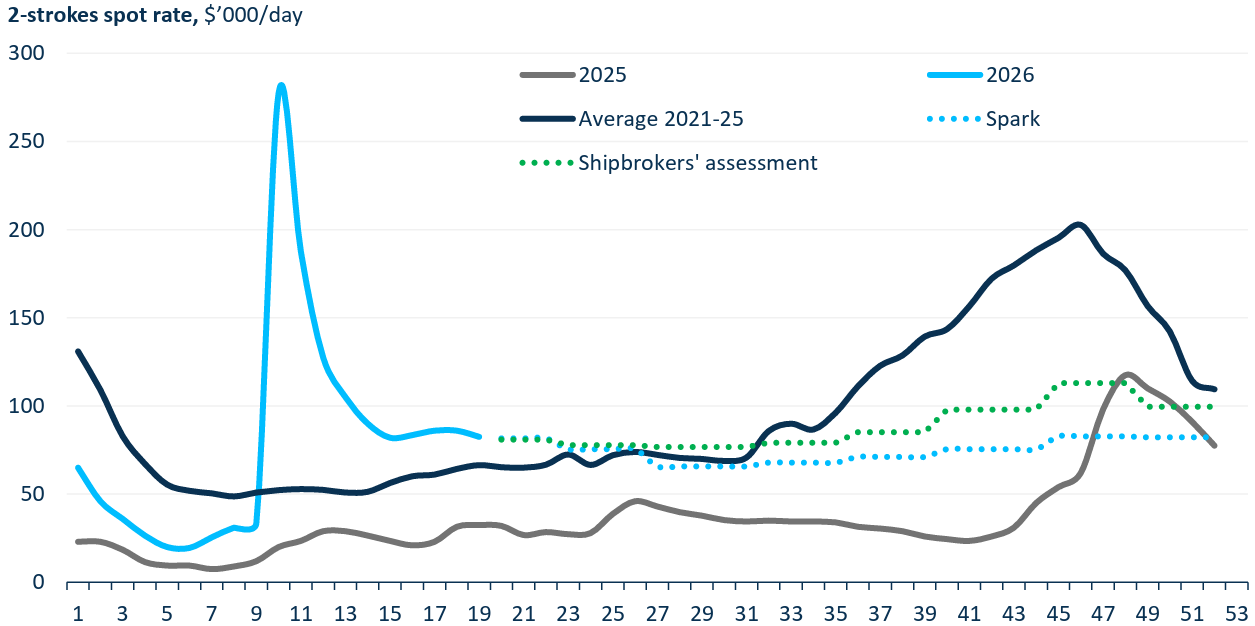
While charter rates have normalized from recent peaks, the spot market has established a higher baseline. Daily earnings have stabilized in a corridor between $80,000 and $90,000. Forward assessments from shipbrokers and Spark curve data indicate this strength has longevity. Rather than reverting to historical averages, the forward curve points to a steady rate plateau for the rest of 2026, which in our view should support free cash flow generation through year end.
Inventory Tailwinds & Support Floor
Underlying inventory data indicates that this elevated rate environment has a highly durable fundamental floor, driven by acute supply deficits. Compliant floating commercial stocks remain severely depleted, tracking well below the standard five year range. At the same time, the US Strategic Petroleum Reserve stands at ~363M barrels, down from over 600M barrels prior to 2022.
US Strategic Reserve Ending Stocks
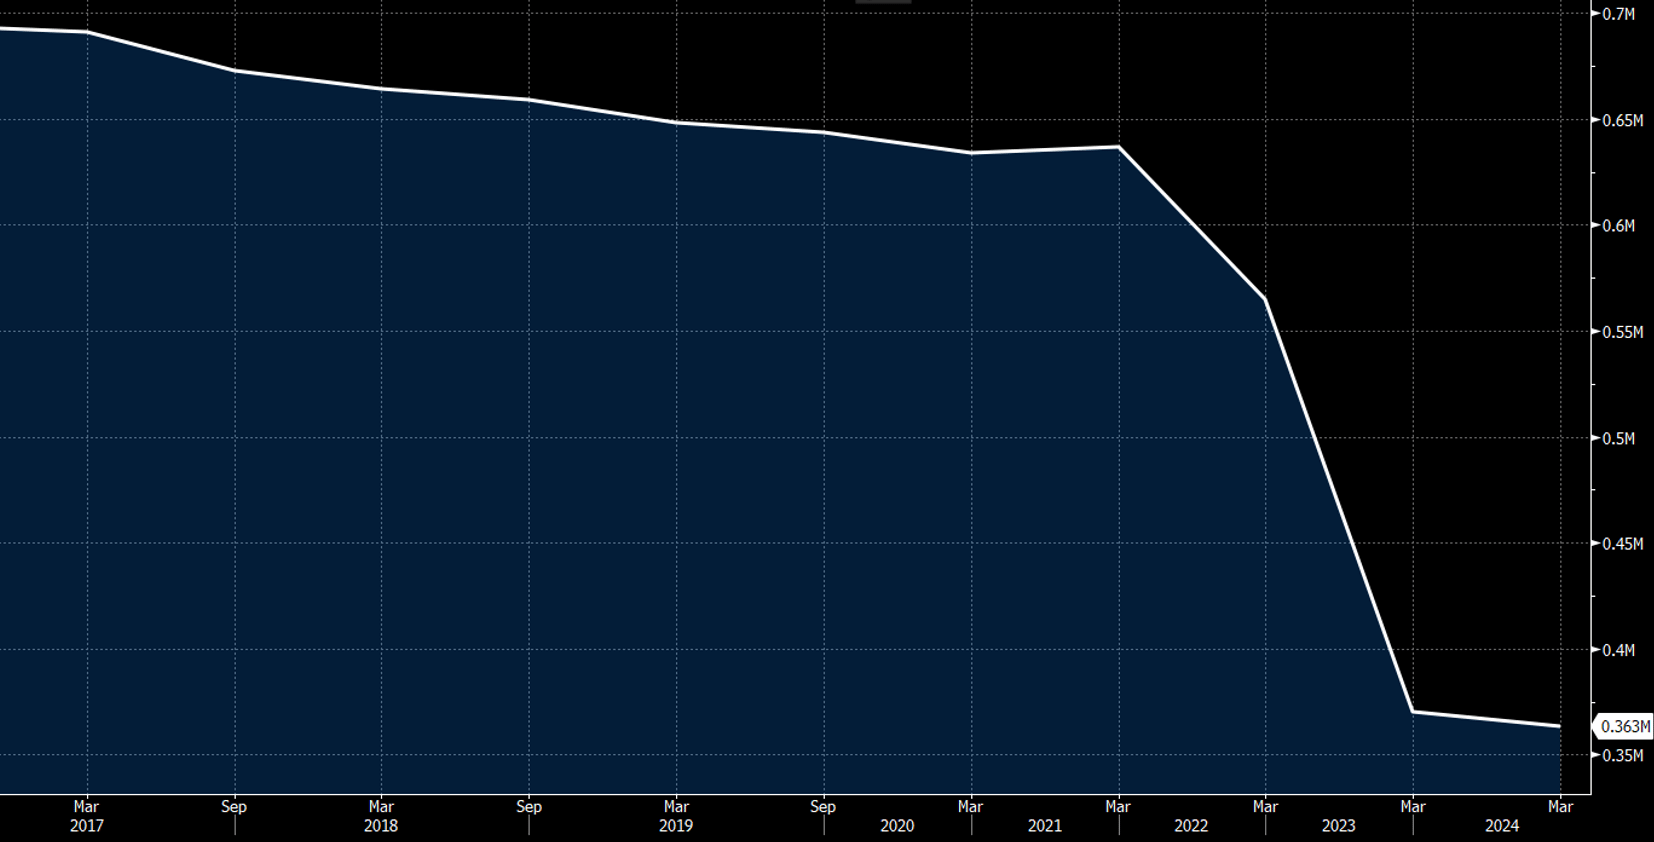
This 205M barrel inventory deficit represents a massive backlog of replacement demand. Restoring the reserve to its historical baseline of over 600M barrels requires purchasing large volumes of seaborne crude over an extended timeline. We believe this multiyear restocking cycle effectively establishes a reliable floor for vessel utilization and charter rates.
Equity Performance & Valuation Variations
Public equity markets reflect the shipping sector polarization. Tanker heavy operators and specialized bulkers occupy the top positions in the marine transportation complex, while container liners show flat or negative returns.
Top performing equities in the index include Tsakos up 98%, China Merchants Energy up 97%, Cosco Shipping Energy up 93%, and Ardmore Shipping up 85%.
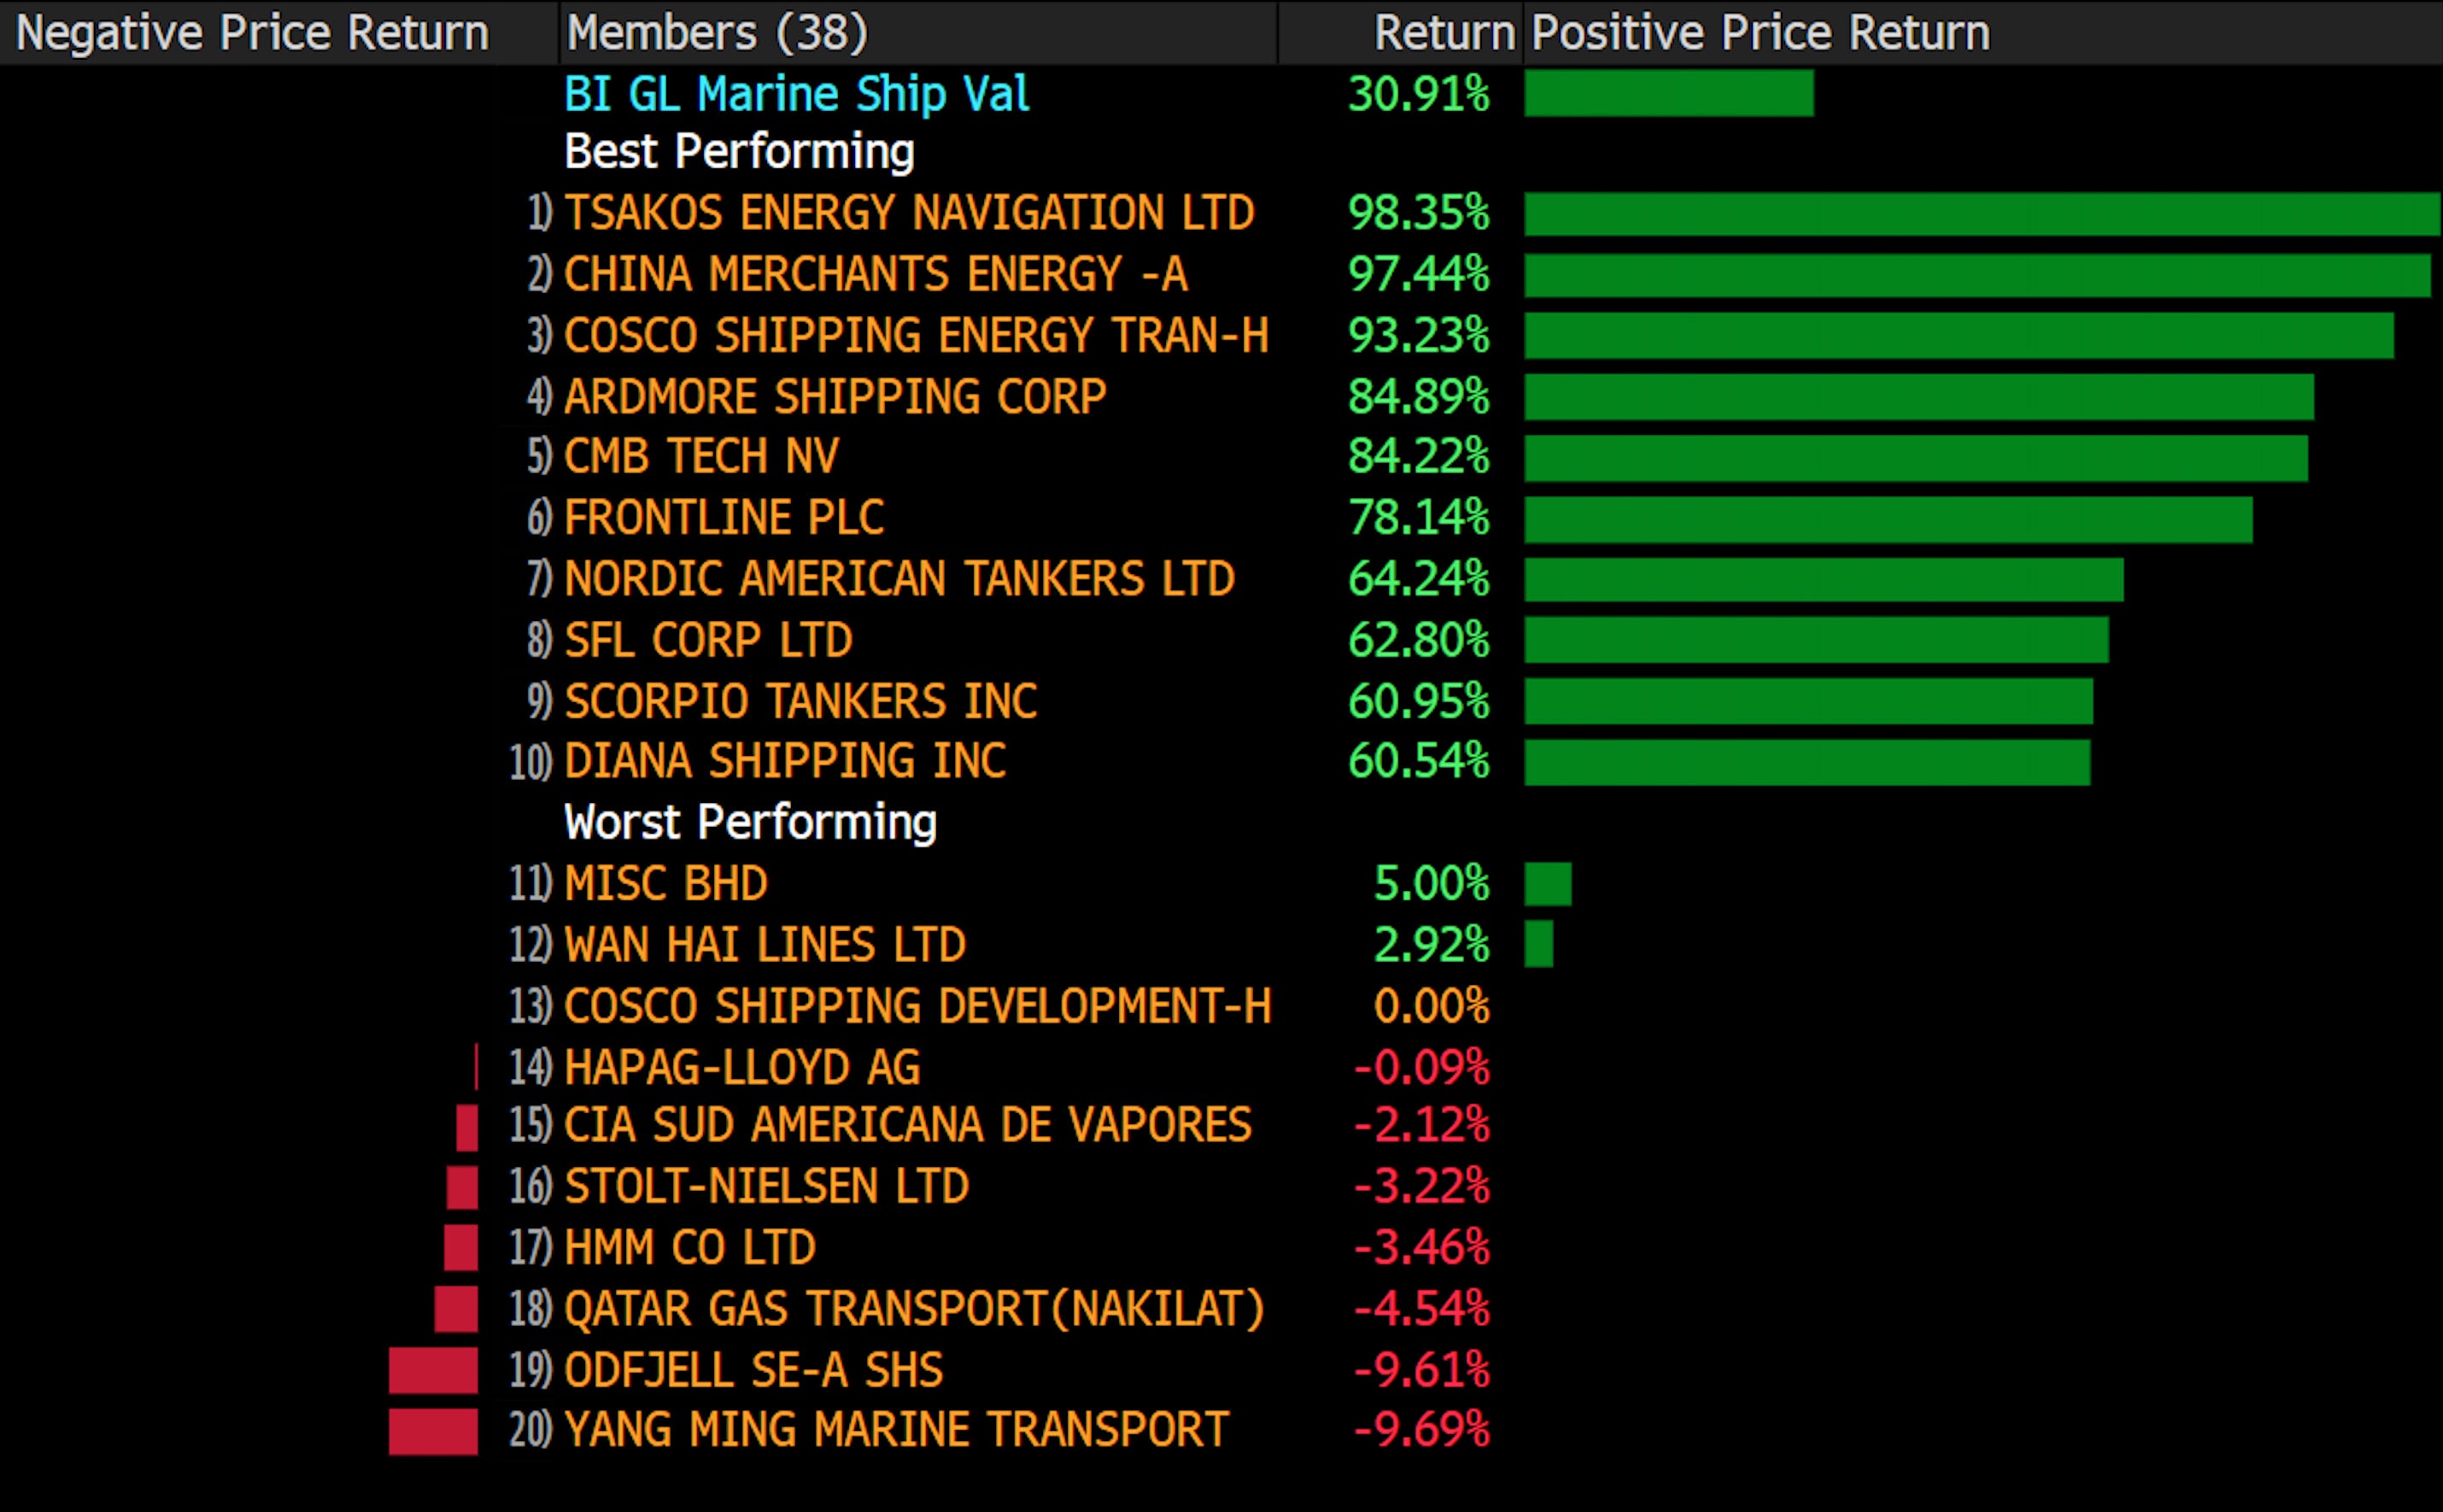
Conversely, companies tied to standard container liner networks or chemical logistics have missed the upcycle entirely. Hapag Lloyd remains flat at 0%, HMM is down 3%, and Odfjell is down 10%. With underlying asset values rising and cash generation hitting multiyear highs, we believe the market valuation of top tier tanker and dry bulk equities still looks too conservative.
6.1 Crude Tanker Market
A common assumption is that the closure of the Strait of Hormuz would severely damage the crude tanker market by cutting off major cargo volumes. However, global demand dictates that this oil must still be sourced and transported.
Instead of destroying tanker demand, the disruption reshapes it. By forcing buyers to replace Persian Gulf barrels with alternative supplies from the Atlantic Basin, the market requires significantly longer voyages. In our view, this multiplication of ton mile demand means the industry actually requires more vessels to move the same volume of energy, keeping fleet utilization high.
On crude oil tankers, we want to remind readers that we flagged this trade back in November 2025, before the conflict began and before rates moved.
We called it the smoothest trade in shipping at the time, and the market proved us right. Rates surged to levels not seen in years, and we think the momentum continues into 2026. The data we are seeing today only reinforces that view.

Fleet Reallocation & Atlantic Ballasting
The realignment of global trade routes has shifted tonnage heavily toward the Atlantic Basin. Throughout the second half of 2025, the number of crude tankers ballasting to the Atlantic stayed stable between 150 and 180 vessels.
More Vessels Ballasting to the Atlantic Basin
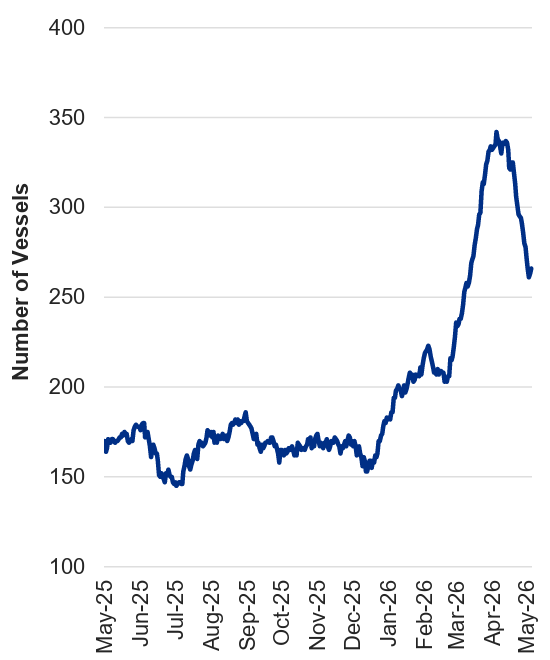
Following market disruptions in early 2026, this number accelerated to a peak of roughly 340 vessels in April before easing to around 265 vessels in May. In our view, this shift leaves fewer ships available in other regions, which should keep spot capacity tight across the rest of the world.
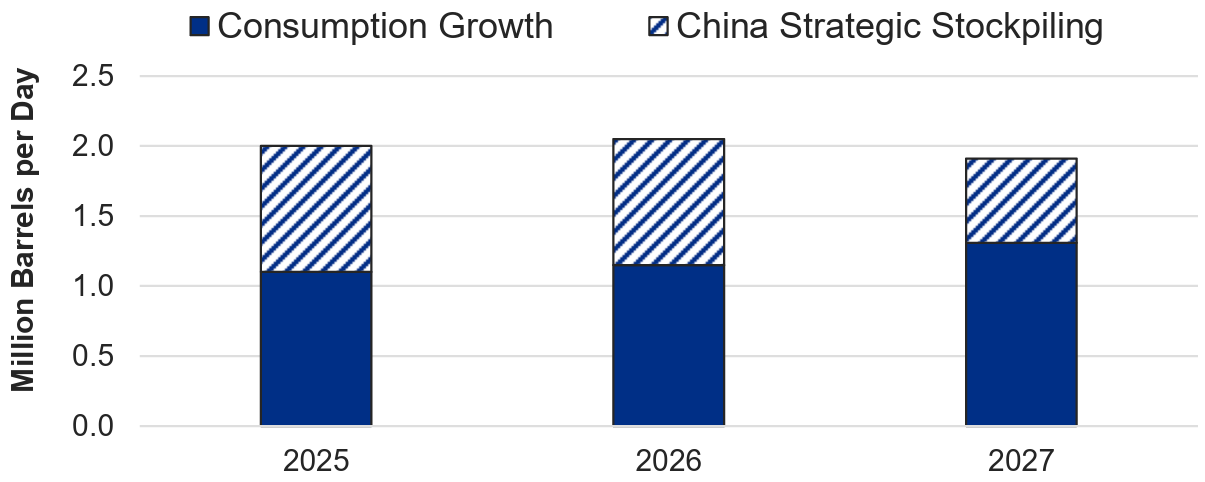
Onshore Inventory Draws & Demand Drivers
Global oil demand remains stable through 2027. Global consumption growth stays above 1.0M barrels per day, while China’s strategic stockpiling contributes an additional 0.6M to 0.9M barrels per day. While these factors provide a steady baseline for the market, we see the primary driver for tanker rates right now as the liquidation happening in land-based storage.
Global Oil Demand Forecast Remains Stable
During the first quarter of 2026, onshore inventories climbed to a peak of 3,425M barrels in April, moving above the 2020–2025 average. This build happened as the market adjusted to the initial Hormuz disruption. Since then, the situation has reversed. Refineries are drawing down these land-based stocks at a pace of 4.6M barrels per day through May and June.
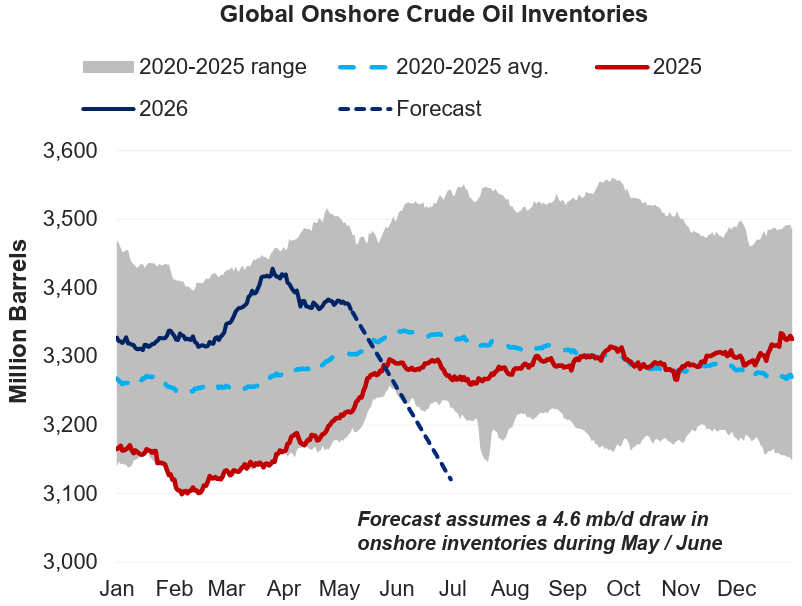
In our view, refineries are using local safety cushions to sustain operations, drawing stocks toward low levels by July. Once these buffers are depleted, refiners must rely on seaborne imports from the Atlantic Basin to maintain daily throughput. This depletion creates a lag effect that should keep tanker utilization high and support long haul rates through the second half of the year.
Mid Size Supply Side Realities
The supply metrics for mid size tankers point to a tight multiyear outlook because orderbooks face pressure from an aging global fleet. In the Suezmax segment, the orderbook stands at 178 vessels. This forward capacity is offset by an aging compliant fleet of 125 vessels that are 17 years or older, alongside 105 older vessels tied up in sanctioned trades.
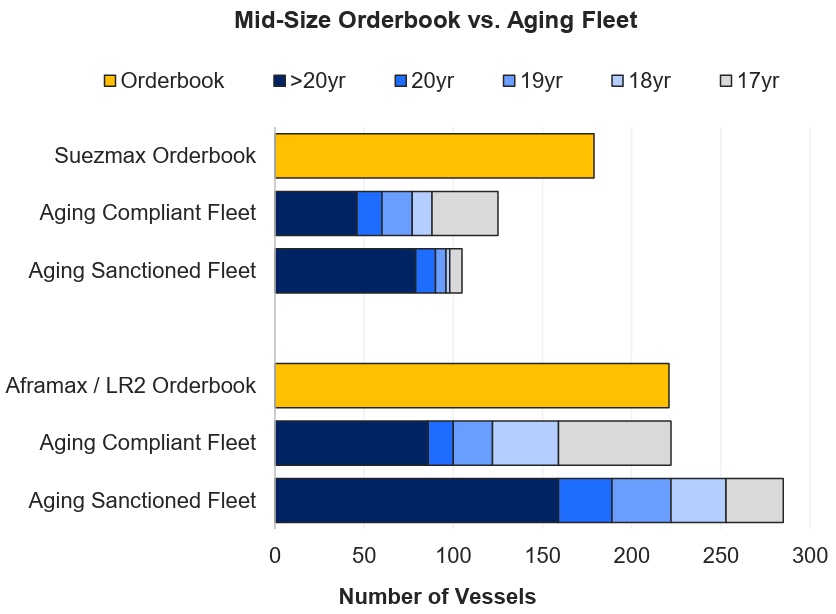
The imbalance is even clearer in the Aframax and LR2 sector, where the orderbook of 221 vessels is matched by an aging compliant fleet of 221 vessels, while the aging sanctioned fleet stands at 285 vessels. We think that as a large portion of the fleet hits retirement age, retirement pressure and compliance rules will limit net fleet growth and keep the supply of commercial ships tight.
6.2 Dry Bulk Market
The dry bulk market is our favorite shipping segment for 2026.
The setup reminds us a lot of what we saw with crude oil tankers in 2025. Valuations have come down to levels that do not reflect what we think the fundamentals actually support. Ton-mile demand is growing, the fleet is aging, El Niño adds potential upside in the second half, and the stocks are trading at a discount to their earnings power.
Demand Dynamics & Ton-Mile Expansion
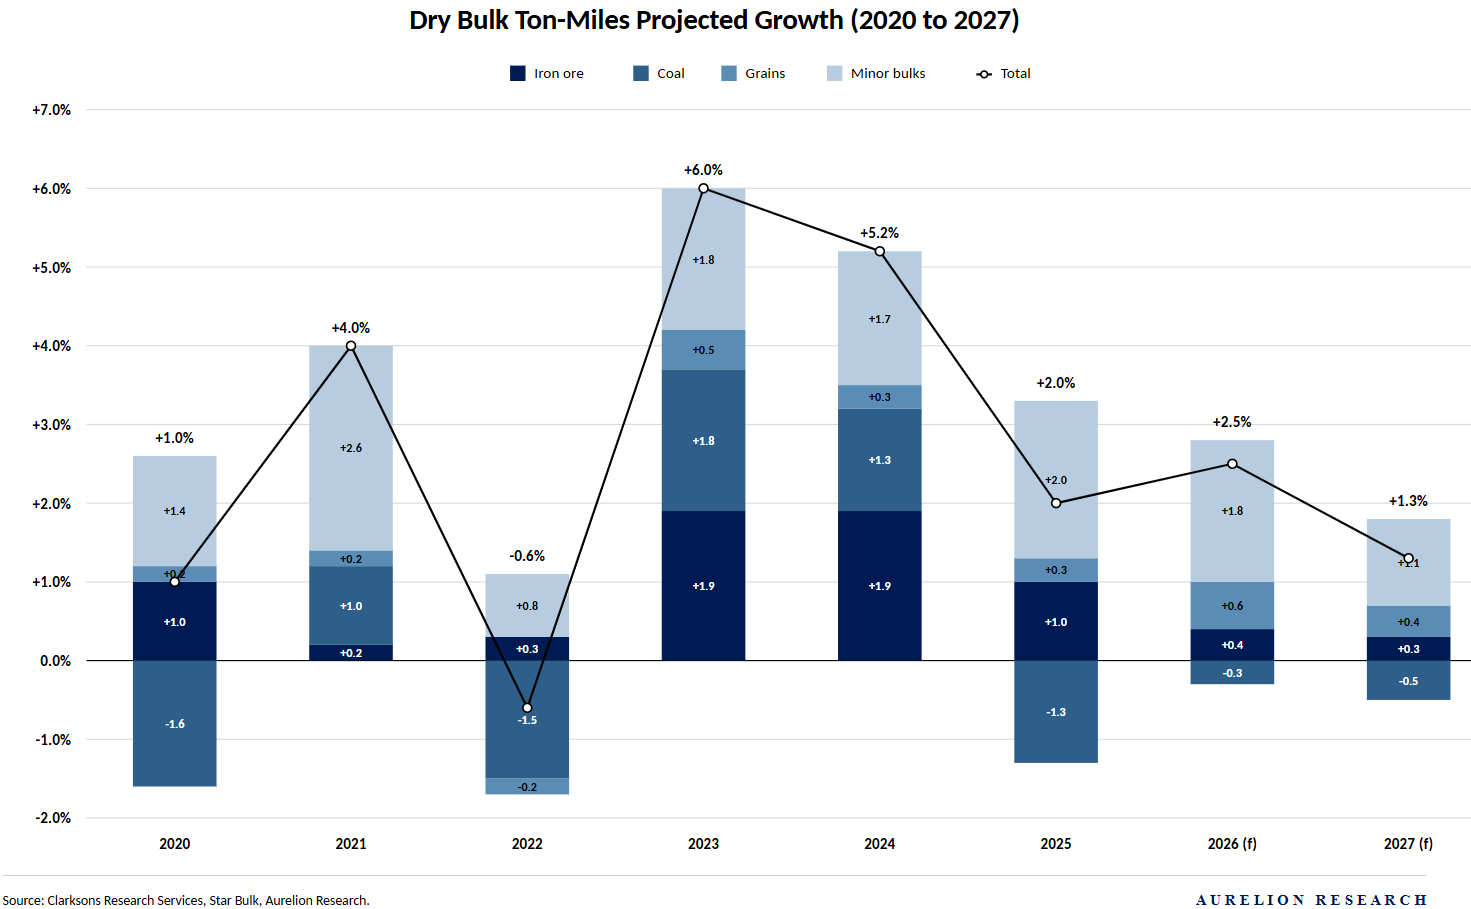
Total dry bulk cargo volume is expected to grow 1.3% in 2026. That sounds modest, but the more interesting number is ton-mile demand, which is growing at 2.5%. Ton-miles measure not just how much cargo moves, but how far it travels. When that number grows faster than volume, it means trade routes are getting longer and ships are staying busy for more days per voyage. Q1 confirmed this, with volumes up 3.5% YoY, lifted by an 8.1% recovery in Chinese imports.
Dry Bulk Ton-Miles Growth
Grains are the main driver of this mileage expansion, with volumes projected to grow 3.7% and ton-miles 6.8%, supported by strong exports from major Atlantic suppliers sailing longer distances to reach Asian buyers.
Minor bulks, including bauxite out of Guinea, are also adding demand for larger Capesize vessels. Iron ore from Brazil and West Africa continues to provide support, even as China’s domestic steel output softened in Q1. Coal is the weak spot, expected to decline 1.6% in volume and 0.5% in ton-miles.
El Niño: A Variable Worth Watching
Weather could play a bigger role in the second half of 2026 than most people are factoring in. Forecasters put the probability of an El Niño event at 61% between May and July, rising to around 94% through year end.
For dry bulk, we think the implications are meaningful. Drought conditions lower water levels at the Panama Canal, cutting daily transits from 36 vessels down to 24 and forcing ships to reroute around the Cape of Good Hope, adding weeks to voyages. Warmer and drier conditions in Southeast Asia reduce hydropower generation, pushing up thermal coal imports to meet energy demand.
And shifting rainfall patterns across South America and Australia affect crop yields, changing where grain needs to come from and how far it needs to travel.
At 94% probability through year end, El Niño is more likely than not. If it materializes, we believe the second half of 2026 could look considerably stronger for dry bulk than current forecasts suggest.
Supply Side Growth & Fleet Constraints
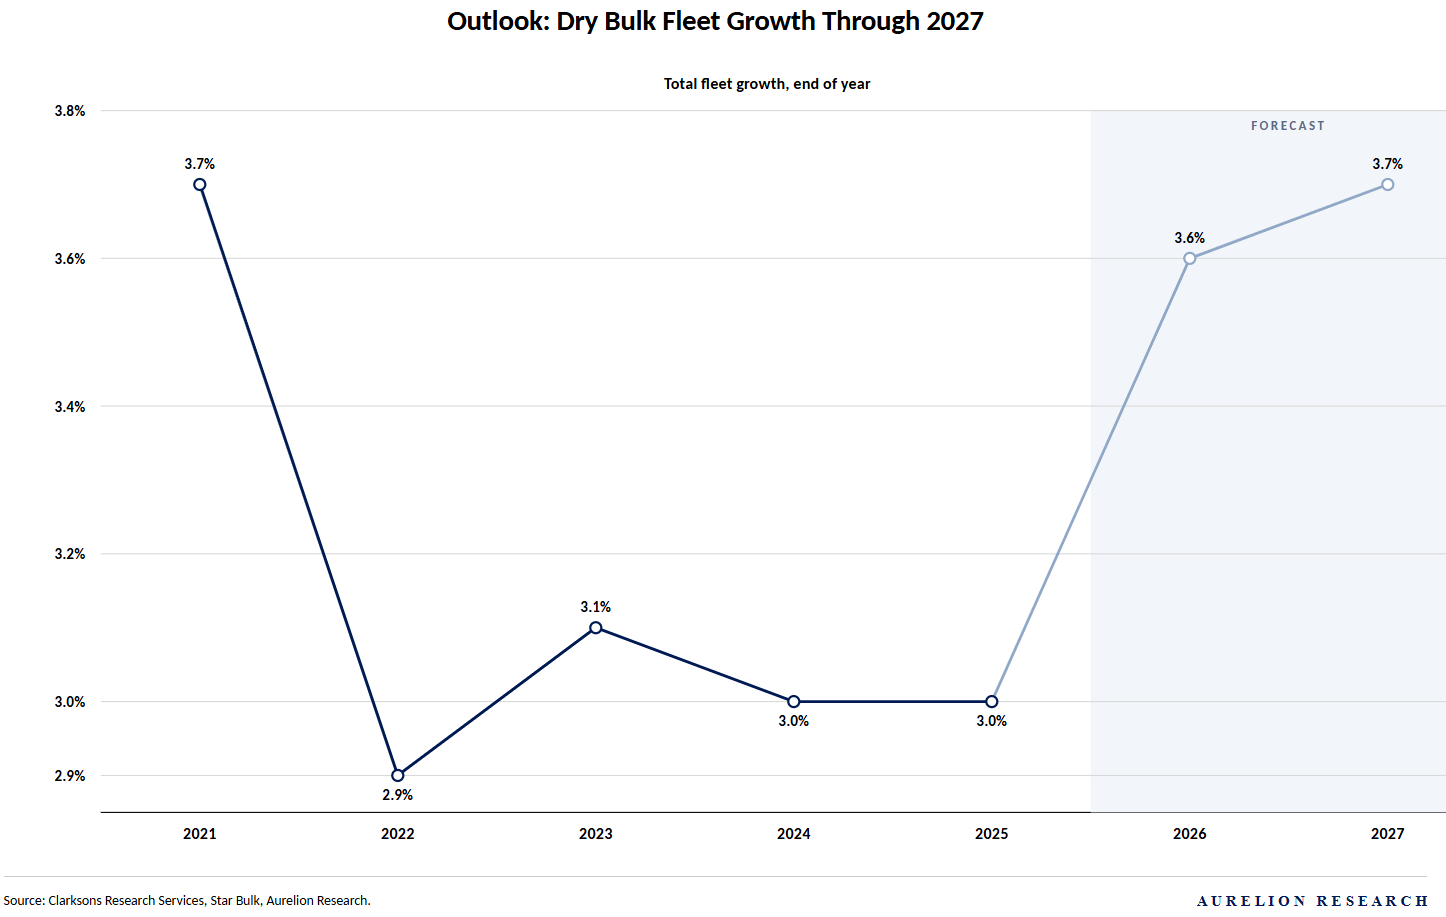
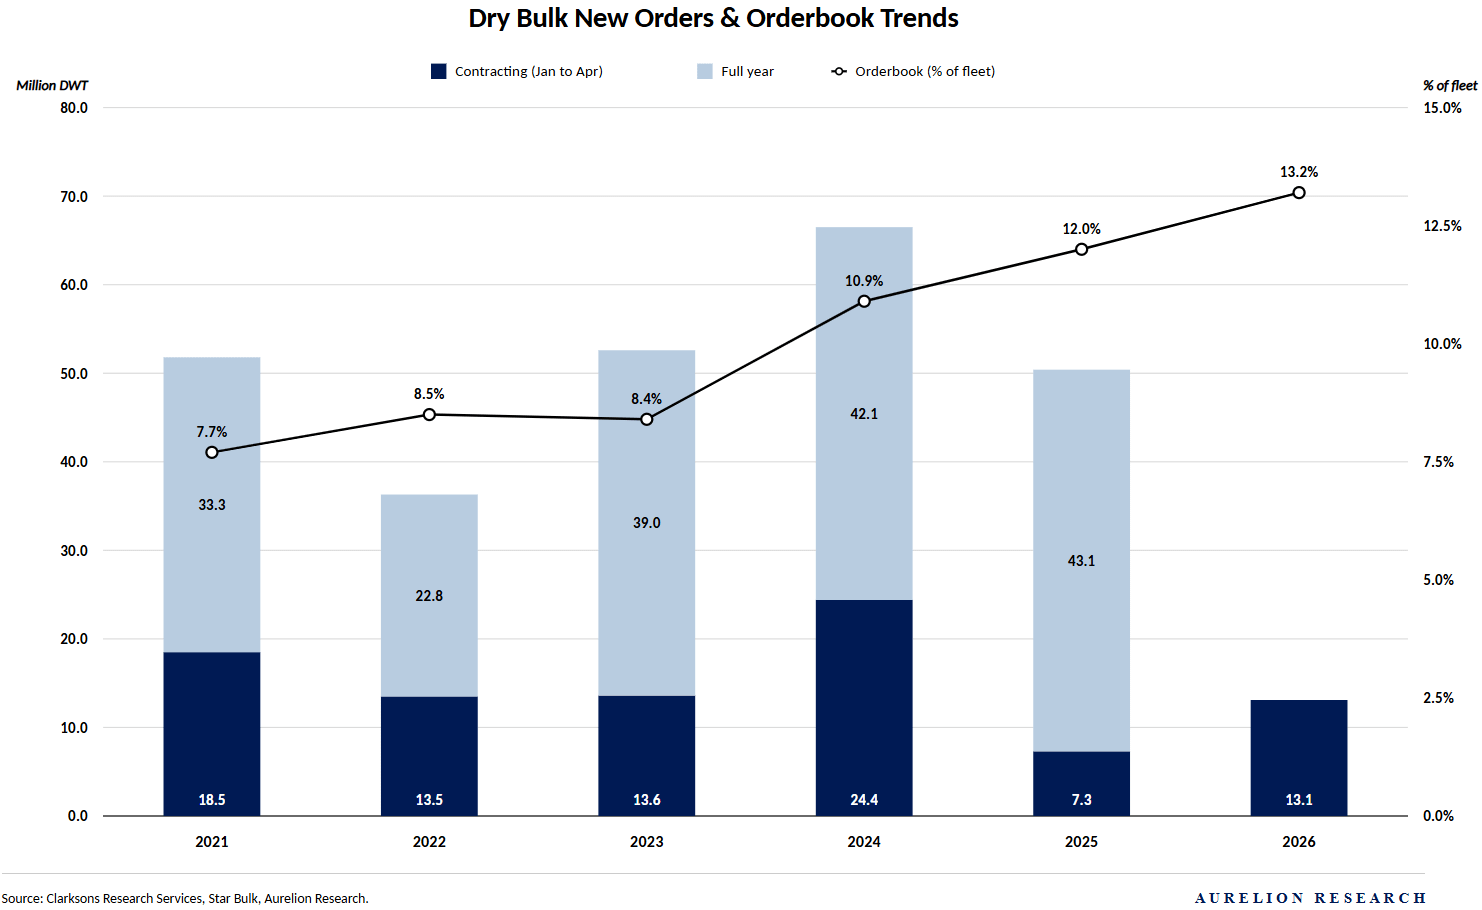
Fleet growth is accelerating. New orders have been coming in at a pace not seen in several years, and the orderbook now represents 13.2% of the existing fleet.
What is worth noting is that contracting activity in just the first four months of 2026 has already matched the pace of full years past. Shipowners are clearly betting on sustained demand, and yards are filling up as a result.
Those numbers look significant, but a third of the global dry bulk fleet, around 362M DWT, is made up of ships over 15 years old. As vessels age, they spend more time out of service for mandatory inspections and maintenance.
New deliveries do not simply add to available capacity on a one for one basis, because older ships absorb a portion of that growth through downtime. The gap between ships on order and ships actually available to carry cargo is larger than the orderbook alone suggests.
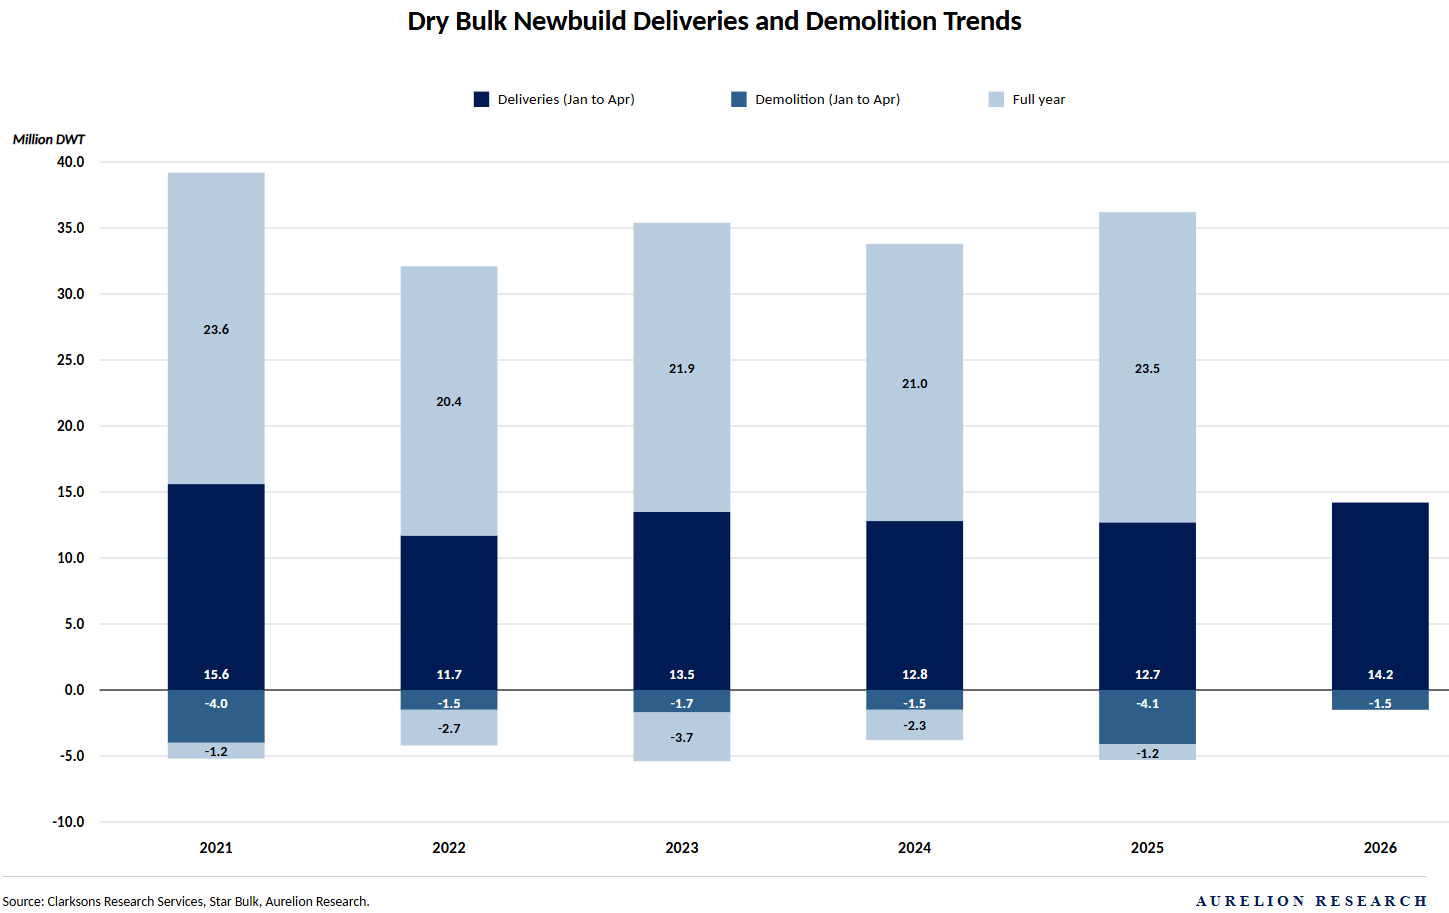
Estimates point to those delays reducing effective fleet capacity by more than 0.5% per year in 2026 and 2027. To put that in context, when a third of your fleet is aging and regularly taken out of service for weeks at a time, the number of ships actually available to carry cargo on any given day is meaningfully lower than the total fleet size suggests. New ships coming in do not simply add to capacity on a one for one basis. A portion of that incoming supply is offset by older ships sitting idle for maintenance. The net result is a market that stays tighter than the headline orderbook numbers imply, which is supportive for rates.
6.3 Product Tanker Market
Product tanker rates have reached historic levels, recently peaking near $80,000 per day following the closure of the Strait of Hormuz. This current spike vastly exceeds the 20-year historical average of ~$18,000 per day, eclipsing previous earnings peaks driven by the war in Ukraine and Red Sea diversions.
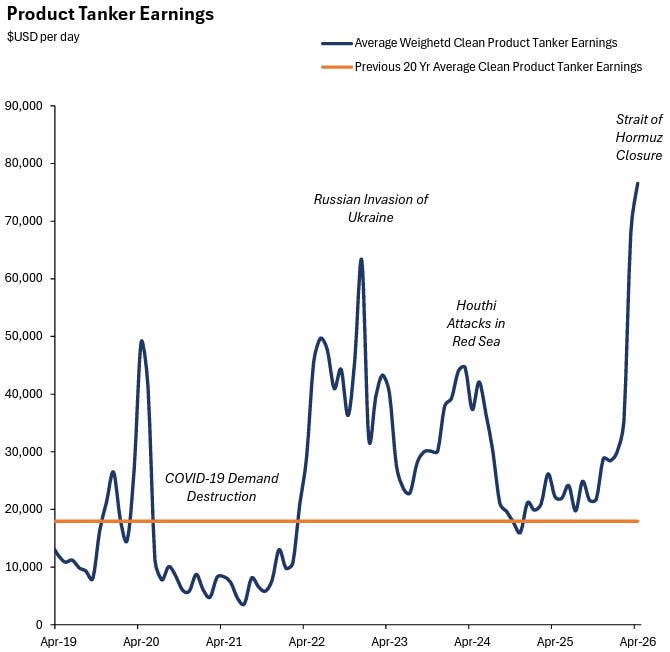
We believe the market remains highly reactive to these compounding disruptions because the baseline supply-demand balance is exceptionally tight.
Demand Drivers: Refineries & Longer Voyages
Global demand for refined products continues to expand, but the main driver of higher rates is the relocation of oil refining capacity.
Longer Voyage Distances: New refining capacity is coming online far from key consuming regions, particularly in the Middle East and Asia.
Ton-Mile Growth: Longer routes increase voyage duration, tying up vessels for more time per trip. This inefficiency boosts global ton-mile demand and effectively reduces available fleet capacity.
Supply-Side Constraints: Aging Fleet vs. Orderbook
While the 2026 year-to-date orderbook appears substantial at 18.5% of the active fleet, it faces an immediate wall of vessel retirements. The global fleet is aging rapidly, creating a severe long-term replacement deficit:
2026e: 21.3% of the active fleet is over 20 years old.
2027e: 25.8% of the fleet will exceed 20 years old.
2028e: 30.6% of the fleet will cross the 20-year threshold.
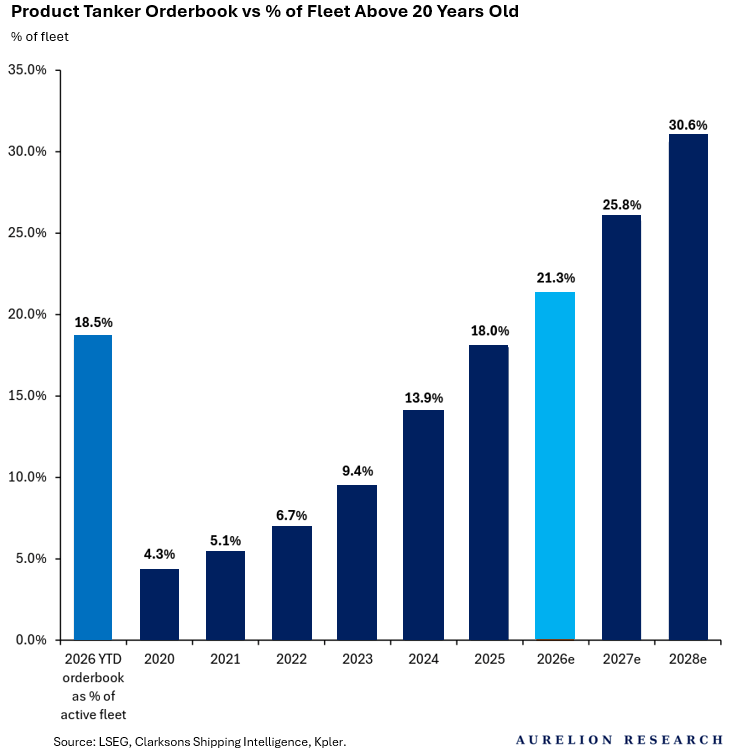
Because the volume of aging tonnage outpaces incoming newbuilds, fleet growth faces downward pressure. Depending on the pace of older vessel retirements, net fleet growth could drop to 0.5% in 2027 and contract by 2.6% by 2028.
Inefficiencies Amplified by the Sanctioned Fleet
A significant portion of global capacity is entirely sequestered from compliant commercial trade routes, worsening the supply squeeze.
The shadow market has absorbed a large share of the global fleet:
Aframax/LR2: 25.5% of the active fleet operates in sanctioned trades.
Suezmax/LR3: 17.2% of the active fleet is tied up in sanctioned trades.
MR/Handy: 9.2% of the fleet is exposed to these restricted routes.
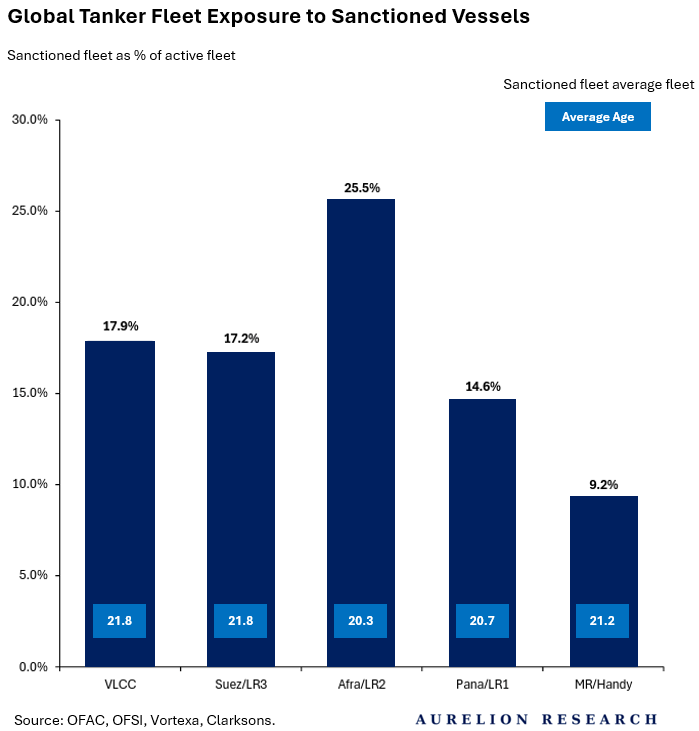
With an average age of over 21 years across all major segments, this shadow fleet avoids the scrap yard by operating exclusively in non-compliant trades. This locks vessels out of the standard commercial pool, forcing compliant operators to compete for a shrinking supply of modern, efficient tonnage.
Consequently, we believe the product tanker market is primed for a prolonged upcycle. Stretched voyage distances ensure incremental demand or geopolitical friction translates directly into elevated baseline earnings for top-tier operators.
6.4 Container Market
The container market is not our preferred shipping segment at the moment. Fundamentals are stable, and the Strait of Hormuz disruption has supported a near-term improvement in freight rates. Supply conditions are also gradually improving as fleet growth slows. However, we continue to see more attractive opportunities in other shipping segments for 2026.
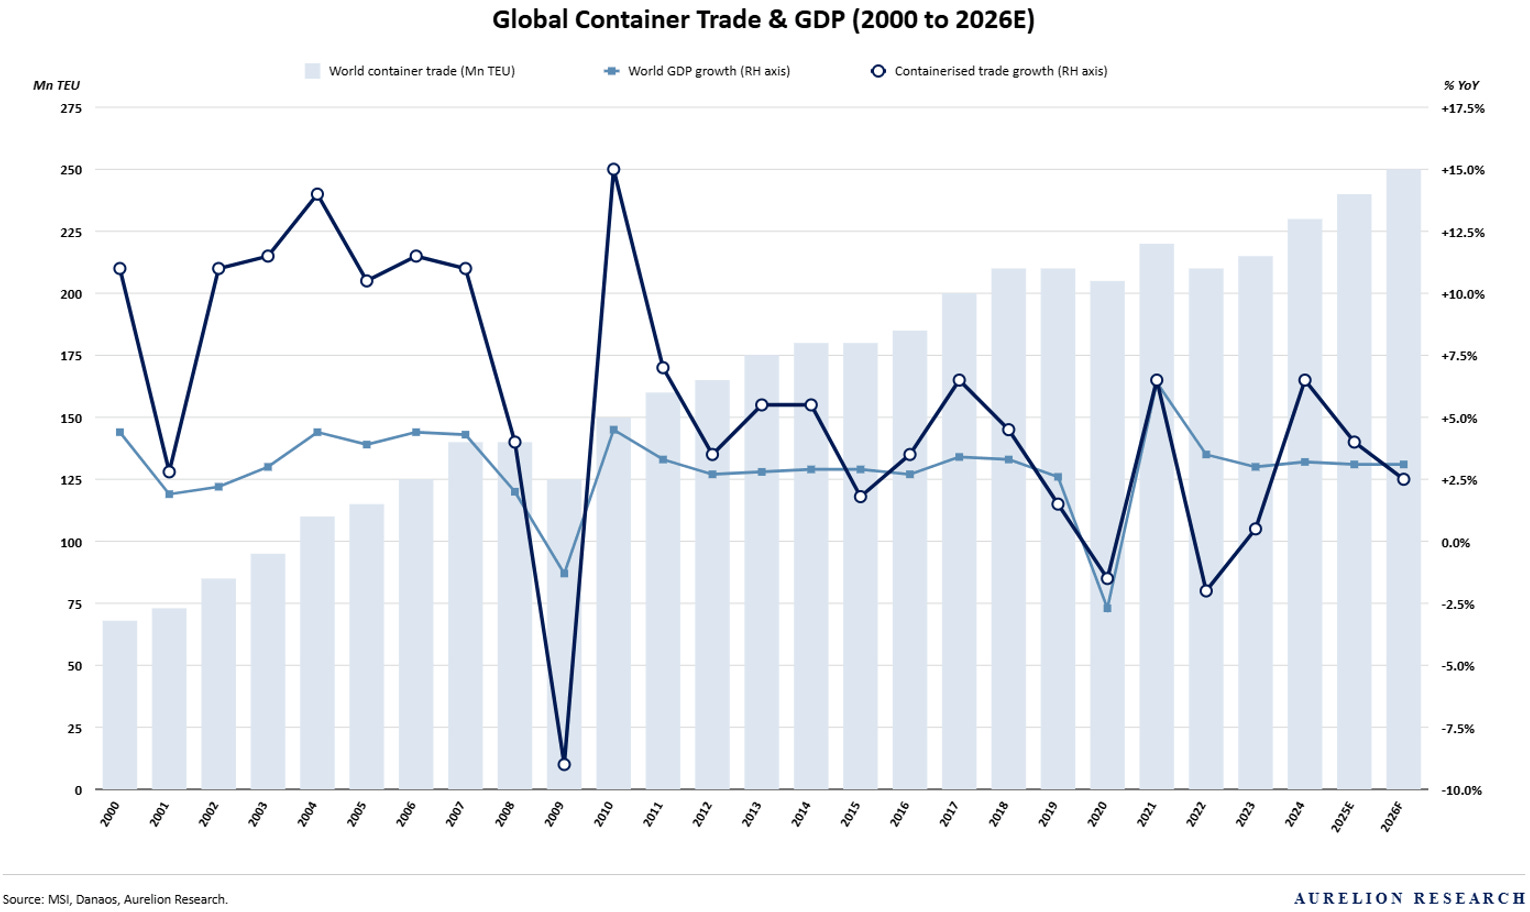
Stable but Slower Demand Growth
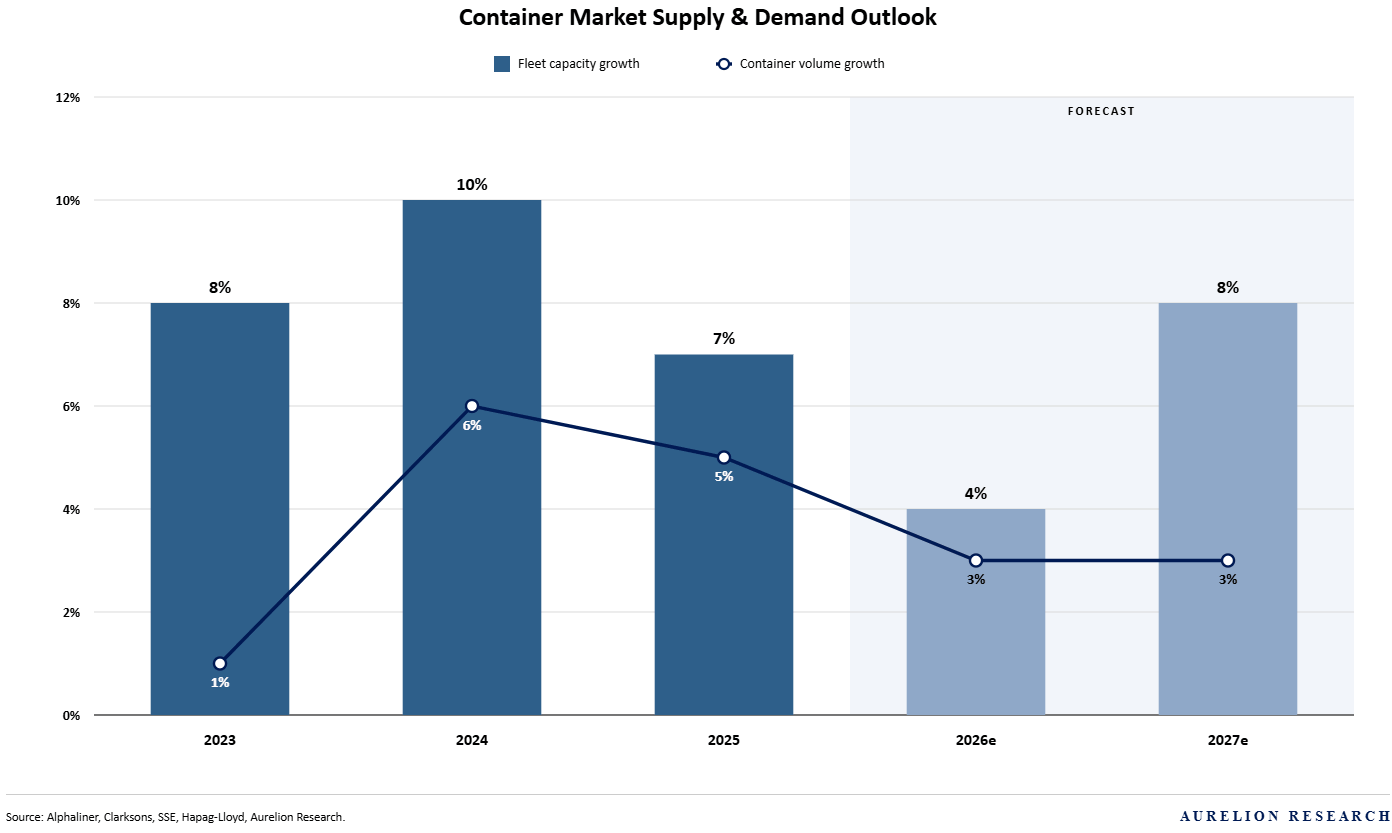
Container trade has grown almost without interruption since 2000, tracking global GDP closely along the way. That long term relationship remains intact. Global container demand grew 4% YoY in Q1 2026, a solid start to the year.
For the full year, demand growth is forecast at 2 to 3%, a step down from recent years and subject to two meaningful risks: the ongoing Middle East situation and US tariffs, which could weaken trade volumes if they persist or escalate.
Supply: The Main Concern
This is where the container market gets more complicated. Deliveries surged dramatically from 2023 through 2024, with quarterly deliveries reaching nearly 900k TEU at the peak. Scrapping over that same period was almost nonexistent. The result is a fleet that has grown significantly faster than demand.
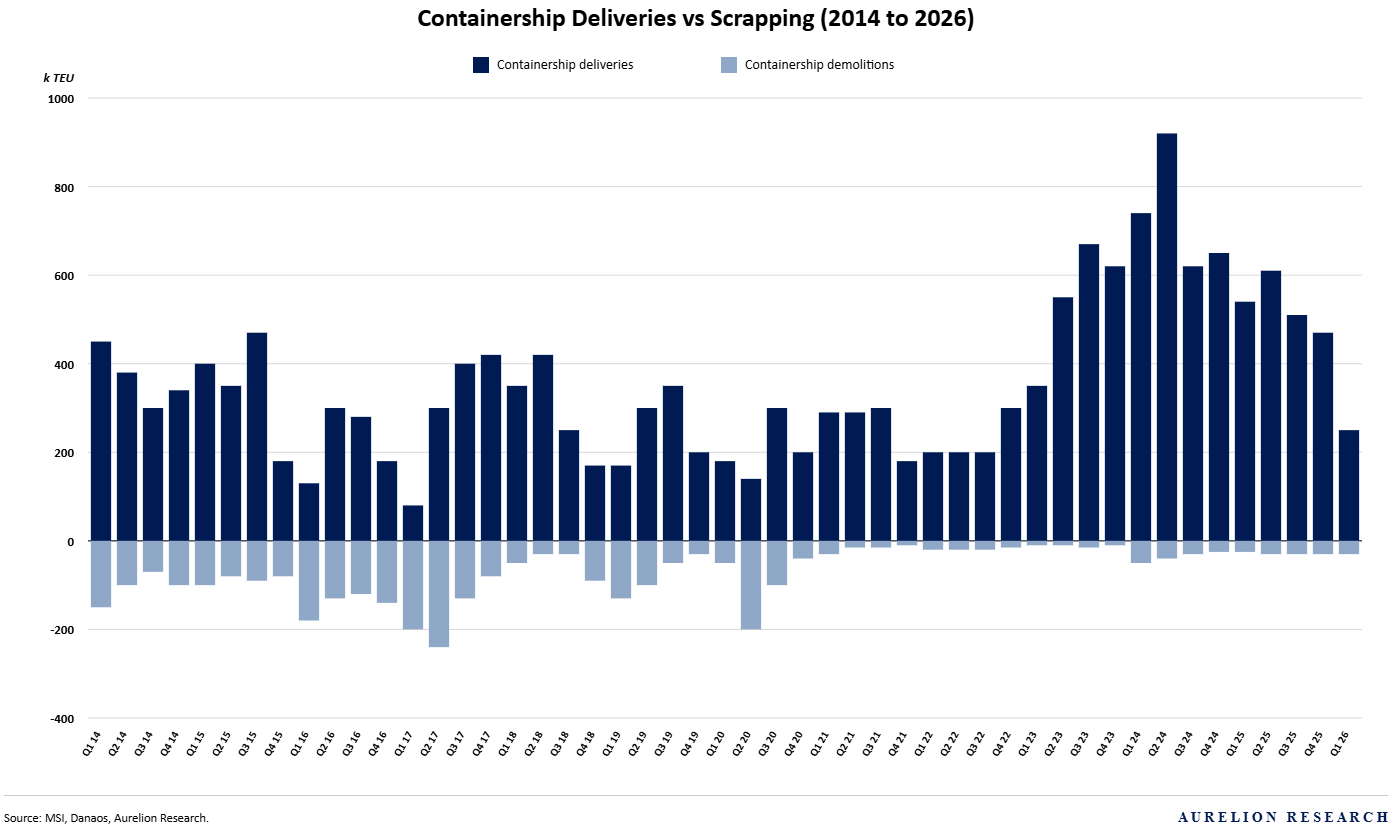
In 2026, fleet capacity growth is expected to moderate to 4%, down from 10% in 2024 and 7% in 2025. Demand is growing at around 3%. Supply is still outpacing demand, just by less than before. That is an improvement, but it is not the kind of tight market that drives exceptional returns.
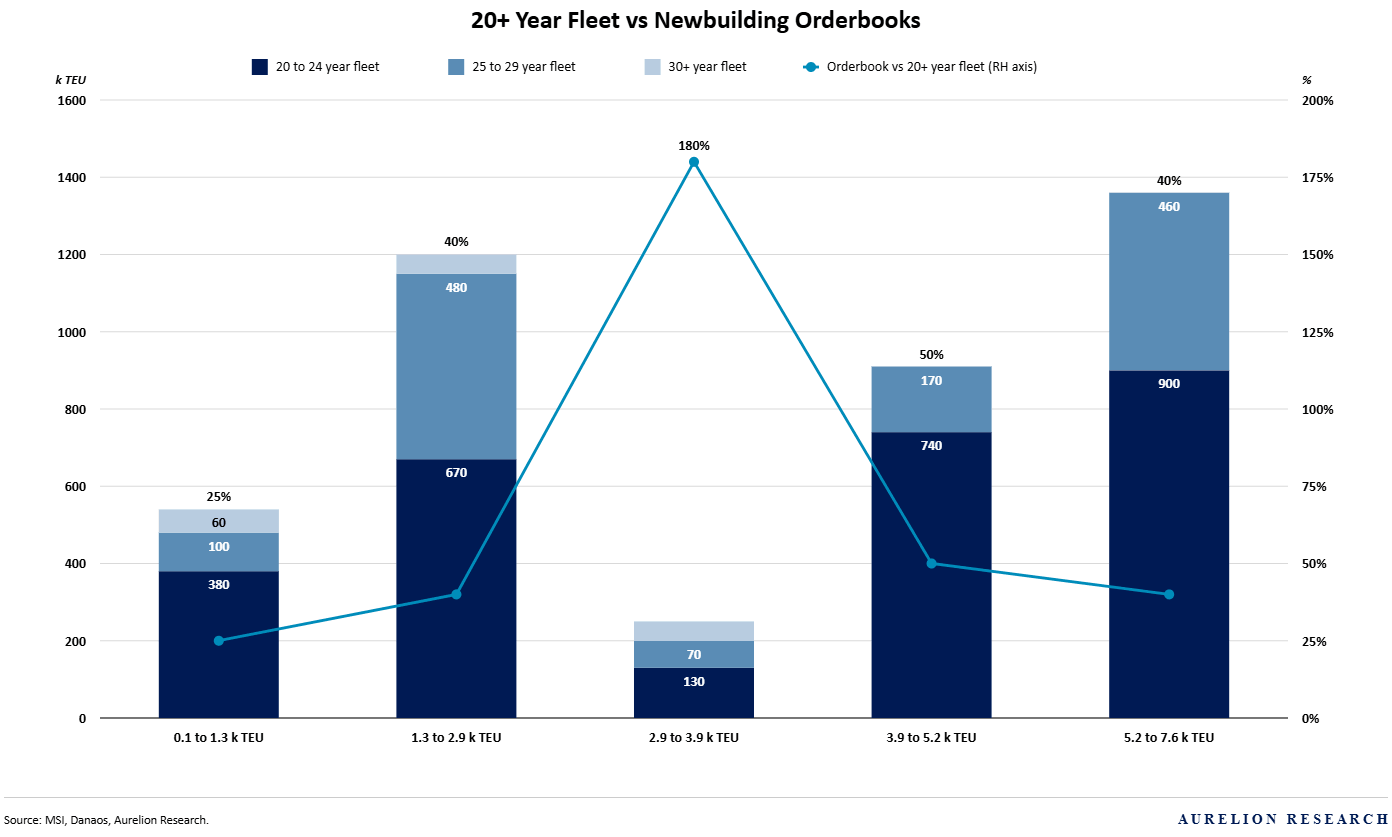
Fleet Age Profile Supports the Narrative
The aging fleet picture adds some nuance. Across most size categories, a meaningful portion of the existing fleet is over 20 years old. In some segments, the orderbook as a percentage of that aging fleet is relatively modest, which means scrapping activity could pick up and provide a natural offset to new deliveries over the next few years.
Rates: Hormuz Is a Near-Term Tailwind
Spot freight rates have surged following the Strait of Hormuz closure, reflecting higher bunker costs and longer routing distances. That is a genuine near term tailwind, but it is worth being clear about what is driving it. Higher rates from route disruption are not the same as higher rates from strong underlying demand. When the Strait reopens, we expect that boost to fade quickly.
Our View: The container market is in a reasonable place. Demand is growing, rates have held up better than many expected, and the supply wave is starting to moderate. But with fleet capacity still growing faster than trade volumes and the Hormuz tailwind likely temporary, we do not see the container market as the most compelling opportunity in shipping right now. It is a sector worth having exposure to, but we would size it accordingly.
7. 2026 Outlook for Shipping Rates
Rates are where the money is made or lost in shipping, and 2026 has already been one of the most volatile years on record across every segment.
The Strait of Hormuz closure reset the picture entirely, creating extraordinary earnings in some markets while leaving others largely unaffected. Below we break down where rates stand today and what we think drives them from here across crude tankers, product tankers, dry bulk, and containers.
7.1 Crude Tanker Rates
Crude tanker rates experienced one of the most dramatic moves in a decade during Q1 2026. Three forces converged at the same time: the Strait of Hormuz disruption, a Sinokor concentration play, and the draining of floating inventories. The result was a rate spike that caught most of the market off guard.
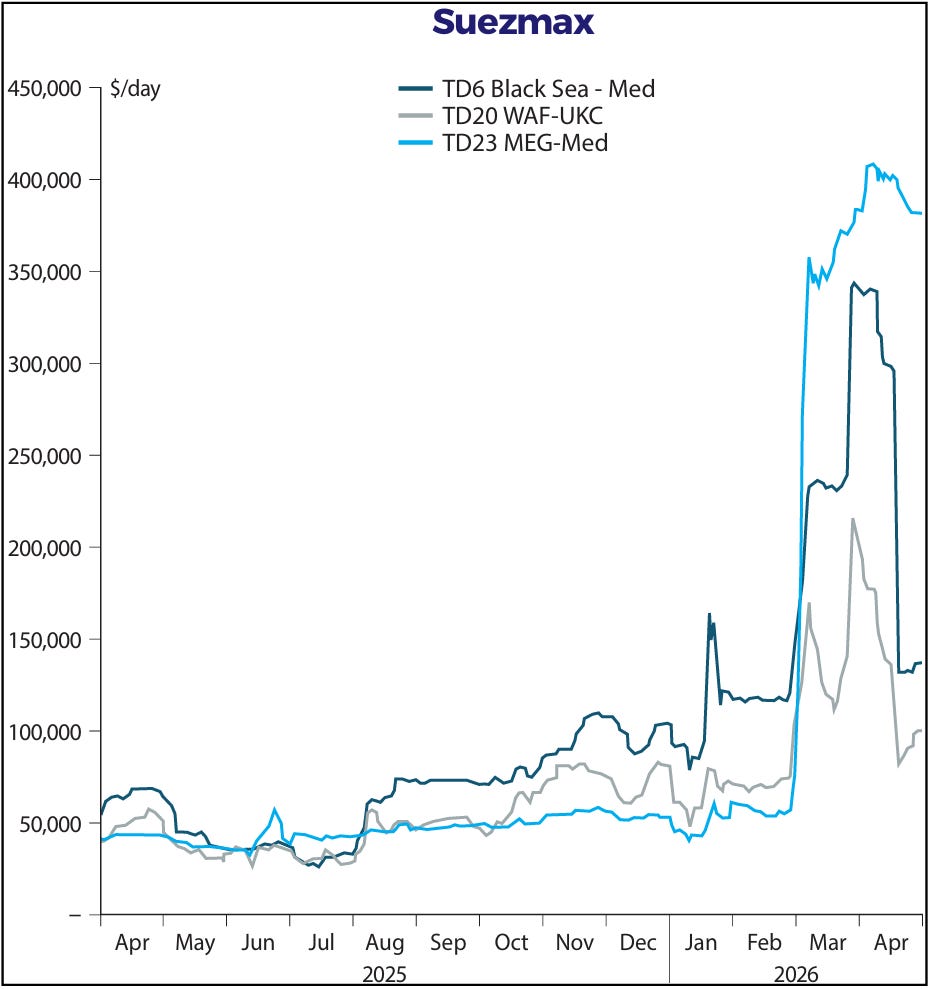
VLCC rates on the Middle East Gulf to East route surged to ~$600,000 per day at the peak in early March, a level not seen since the brief COVID-era spike in 2020.
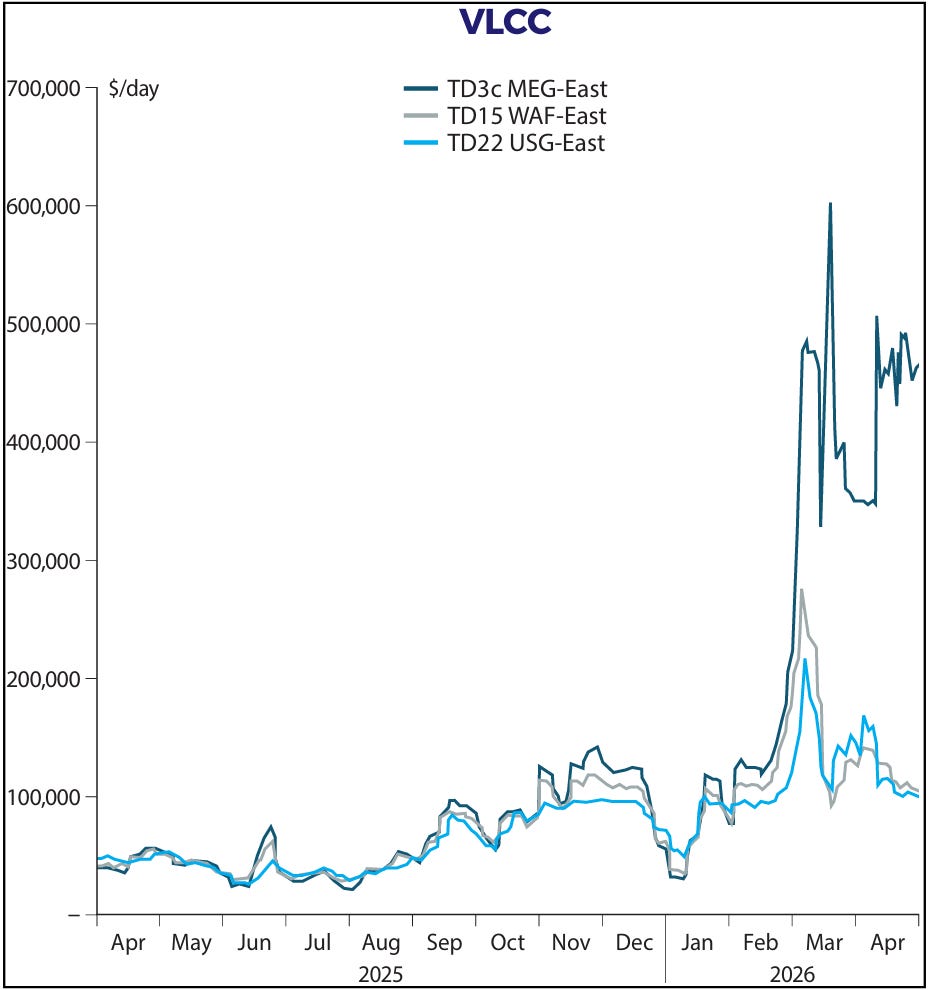
Suezmax rates on the Middle East Gulf to Mediterranean route reached over $400,000 per day. Both have since moderated, but rates remain well above where they were before the conflict began, with VLCCs still earning nearly $300,000 to $400,000 per day and Suezmaxes holding in a similar range.
The Hormuz Shock
Around 14.9M barrels per day of crude exports and 35% of global crude ton-miles transit the Strait of Hormuz. That makes this the largest single chokepoint disruption ever recorded. The immediate effect was a near total halt in tanker traffic through the Strait, with Kpler data showing transits collapsing by around 92% compared to pre-conflict levels.
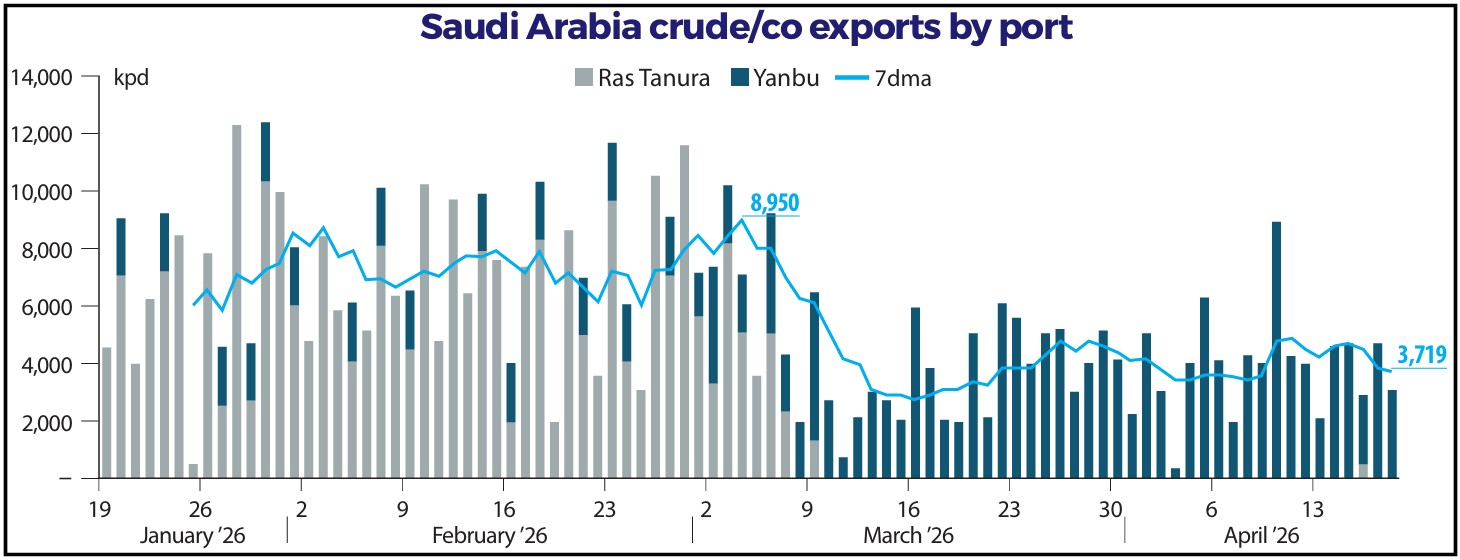
What partially offset the shock was Saudi Arabia redirecting crude exports from Ras Tanura, its main Gulf terminal, to Yanbu on the Red Sea coast. At peak, Saudi exports through Yanbu reached 8,950 kbd. That figure has since come down to around 3,719 kbd, reflecting the limits of that alternative route.
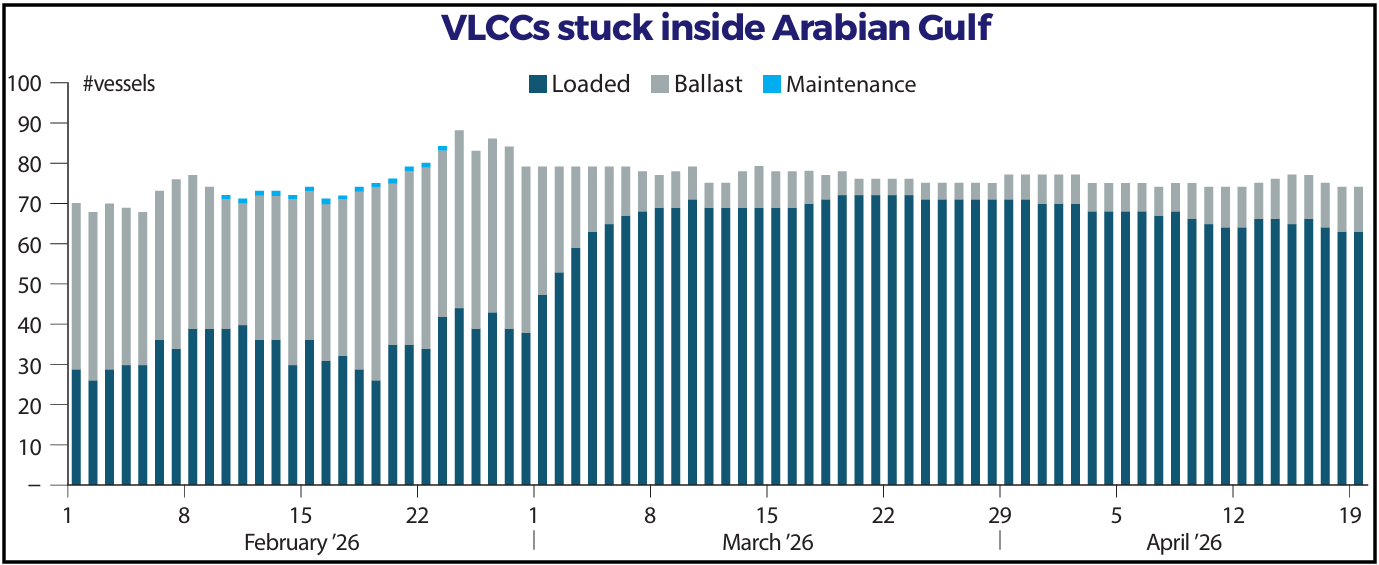
The vessel supply picture tells the rest of the story. At any given point during April, nearly 63 laden VLCCs were trapped inside the Arabian Gulf, with another 60 waiting outside the Middle East Gulf and ~36 more waiting at Yanbu.
That is over 155 VLCCs effectively removed from spot supply at once, a number that has kept the market tight even as the initial rate spike has moderated.
What Is Keeping the Market Supported
The rate spike was the first chapter. What keeps us interested is what comes after it. Going into 2026, crude tanker fundamentals were already in good shape.
The supply and demand balance had been supportive of freight rates since mid 2025, before the conflict added any geopolitical premium. During Q1, a private aggregator moved aggressively to consolidate vessels, pulling compliant tonnage off the spot market and tightening supply further. On top of that, the conflict introduced meaningful rate differences between trade routes, with some corridors commanding premiums that would have seemed impossible a year ago.
Add to that the fact that around 10% of the global VLCC fleet is currently sitting idle, either trapped with cargo in the Arabian Gulf or waiting to load in western Saudi Arabia, and you have a market where the effective supply of working ships is considerably smaller than the headline numbers suggest.
What Could Drive Further Upside
Three things stand out as potential catalysts for the crude tanker market beyond the immediate disruption.
The first is sanctions relief. If Venezuelan or Iranian crude volumes move from the shadow fleet into the compliant market, legitimate shipowners capture that business. At the same time, the shadow fleet loses its main source of employment and much of it gets scrapped. That is a double benefit for compliant operators.
The second is inventory rebuilding. Once the Strait reopens, governments and refiners that have been running down reserves will need to restock. That process generates tanker demand well above what day to day consumption requires, and it could last for an extended period.
The third is fleet retirement. As compliant trade grows and the shadow fleet shrinks, older and less efficient vessels will exit the market. That removes supply from the global pool and keeps the balance tighter than it would otherwise be.
We think the crude tanker market is better positioned than most people currently give it credit for. The extraordinary earnings of Q1 will not repeat at those exact levels, but the medium-term setup still points to a market that remains firmer for longer once the immediate crisis fades. We are already seeing strong Q2 2026 rates being locked in by companies currently reporting Q1 2026 earnings.
7.2 Dry Bulk Rates
Dry bulk rates have had a strong start to 2026. The Baltic 5TC Index is the industry's primary benchmark for dry bulk shipping rates, tracking average earnings across the five main routes.
As shown in the chart below, it opened 2026 around $25,000 per day and climbed to nearly $45,000 by late April, well ahead of where rates stood at the same point in both 2024 and 2025, and above the 2021 to 2025 average.
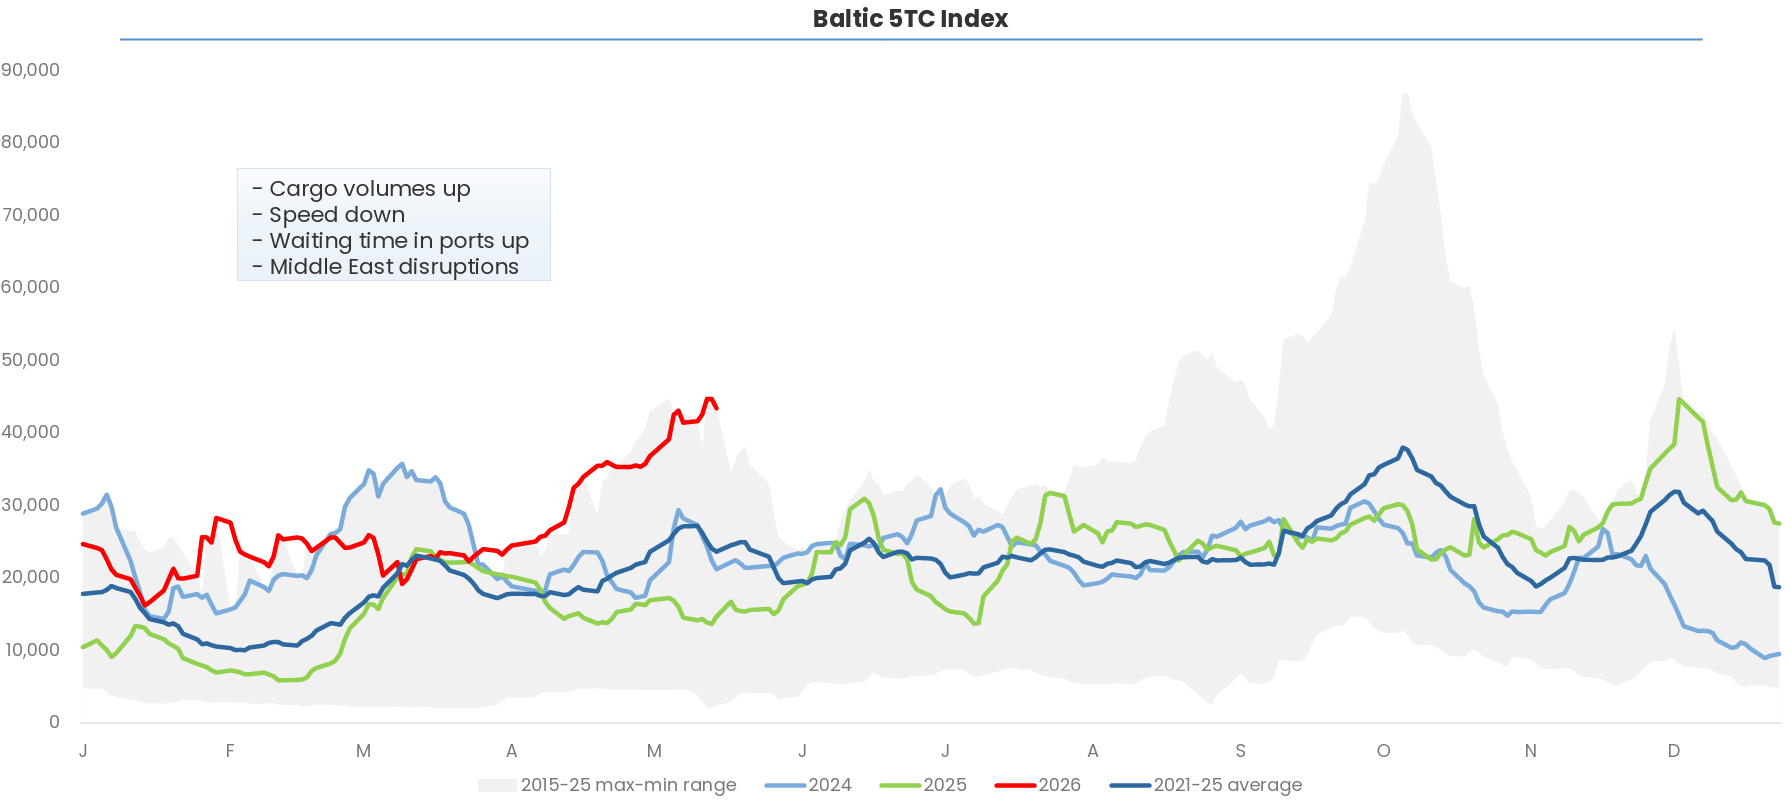
Four factors are driving this. Cargo volumes are up, ships are slowing down to save fuel which reduces fleet availability, port congestion is increasing waiting times, and Middle East disruptions are adding distance and complexity to voyages. Each of these independently tightens the effective supply of ships. Together, they are creating a rate environment that is meaningfully better than what most market participants expected entering the year.
Rates are running in the upper half of the 2015 to 2025 historical range, well above the 2021 to 2025 average but nowhere near the extraordinary levels seen during the COVID era peak in late 2021. For shipowners with modern, efficient fleets, the current rate environment is generating solid cash flow.
The key question from here is sustainability. We believe the demand drivers we outlined, growing ton-miles, El Niño upside in the second half, and an aging fleet absorbing new supply, provide a reasonable foundation for rates to stay supported through 2026. A reopening of the Strait of Hormuz would remove one tailwind, but the underlying demand picture would remain intact.
7.3 Product Tanker Rates
The product tanker market has been one of the biggest beneficiaries of the Strait of Hormuz closure, and the numbers speak for themselves. Medium Range tankers earned an average spot rate of $33,700 per day in Q1 2026, accelerating to $52,100 per day in Q2 to date, according to Ardmore Shipping. International Seaways reported a blended average spot rate above $100,000 per day fleetwide in Q1. These are exceptional levels by any historical standard.
The Strait of Hormuz closure has disrupted ~15% of global oil product flows. Nearly 130 product tankers are now trapped inside the Persian Gulf, significantly tightening vessel supply. To replace lost Middle Eastern volumes, buyers in Asia and Europe are sourcing refined products from the US, West Africa, and Europe instead, on voyages about twice as long as normal. Longer distances increase ton-miles, meaning vessels stay tied up for more time per voyage. Refining margins in the Atlantic Basin have also risen to their highest levels since the pandemic recovery, supporting stronger cargo flows on these longer-haul routes.
The key question is what happens when the Strait reopens.
A portion of these elevated rates will fade as Middle Eastern volumes come back online and the rerouting premium disappears. How much rates soften will depend on how quickly trapped tonnage re-enters the market and how fast Middle Eastern product flows normalize. We think the product tanker market will soften from current levels once the Strait reopens, but the underlying demand picture, growing Atlantic trade flows and an aging fleet, should prevent rates from falling back to pre-conflict levels quickly.
7.4 Container Rates
Container rates tell an interesting story when you look at the price and volume data together. Volume has been remarkably stable over the past five years, moving in a relatively narrow range throughout the peaks and troughs. The price swings, on the other hand, have been dramatic. That tells you this market is being driven by supply dynamics more than demand.
Rates peaked in 2021 at levels that were extraordinary by any historical standard, then collapsed sharply through 2022 and 2023 as the post-COVID shipping boom unwound and the fleet absorbed a wave of new deliveries.
Container Prices vs Volume Since 2021
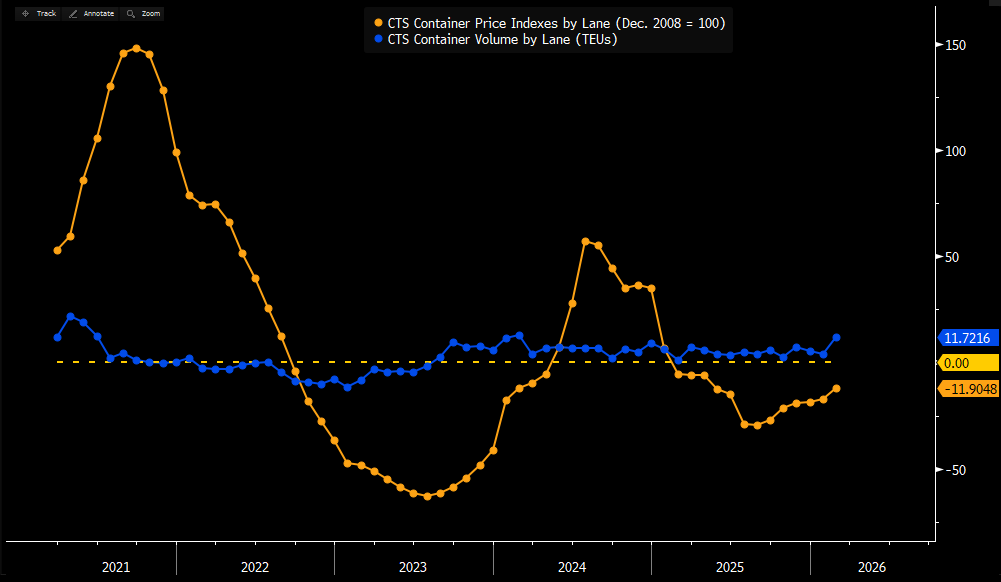
By mid 2023, the price index had fallen deeply negative on a YoY basis. A brief but a recovery followed in mid 2024 as Red Sea disruptions rerouted vessels and tightened effective supply, before rates fell again through late 2024 and into 2025.
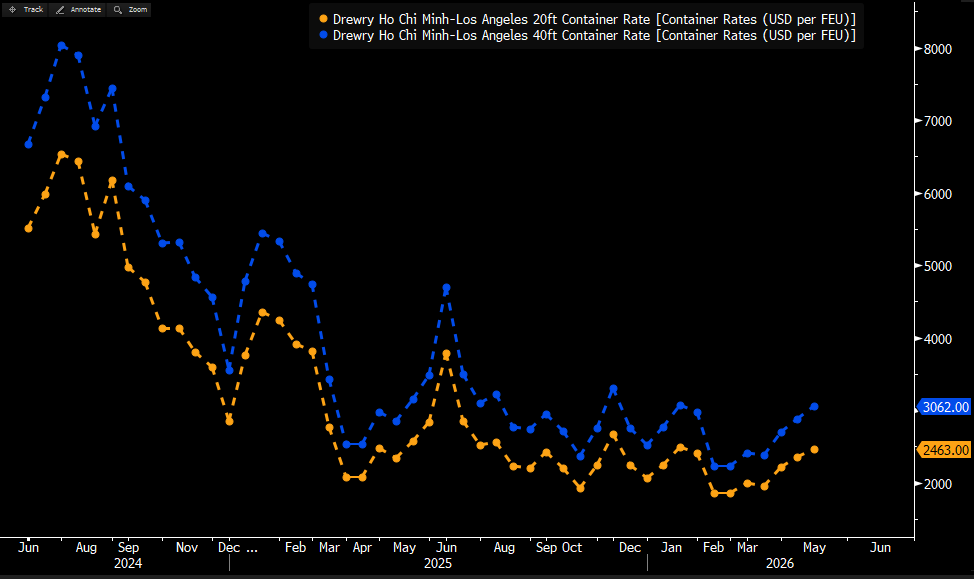
Looking at a specific trade lane gives you a clearer picture of where things stand today. On the Ho Chi Minh to Los Angeles route, one of the busiest Asia to US West Coast corridors, 20ft container rates currently sit ~$2,463 per FEU and 40ft containers ~$3,062 per FEU. Both are recovering gradually from their late 2025 lows, but remain well below the $6,500 to $8,500 range seen at the 2024 peak.
Asia to US West Coast Container Rates
The Strait of Hormuz closure has provided some support to rates through higher bunker costs and longer routing distances, but as we noted in the market section, that tailwind is tied to the disruption rather than underlying demand strength.
When the Strait reopens, that support should fade. We think container rates stay in a modest recovery mode through 2026, supported by stable volumes and gradually moderating fleet growth, but we do not see a return to 2024 peak levels anytime soon. The supply overhang is still working its way through the market.
8. Our Favorite Shipping Stocks
We currently have one shipping company in the Aurelion Index.
We had more exposure earlier this year, but trimmed it down when the concentration risk felt too high relative to the potential reward.
Today we are adding back a name we think is well positioned for what is happening in the market right now. Below we break down each name, what makes it interesting, our valuation, and our price targets.
You can access our Plutus Shipping Basket here.
8.1 Top Idea #1: Okeanis Tankers
Okeanis Tankers (ECO) is already in the Aurelion Index.
We published a full in depth report on ECO on December 11, 2025. If you have not read it yet, we recommend starting there as it covers the company in considerably more detail than the overview below.

Company Overview
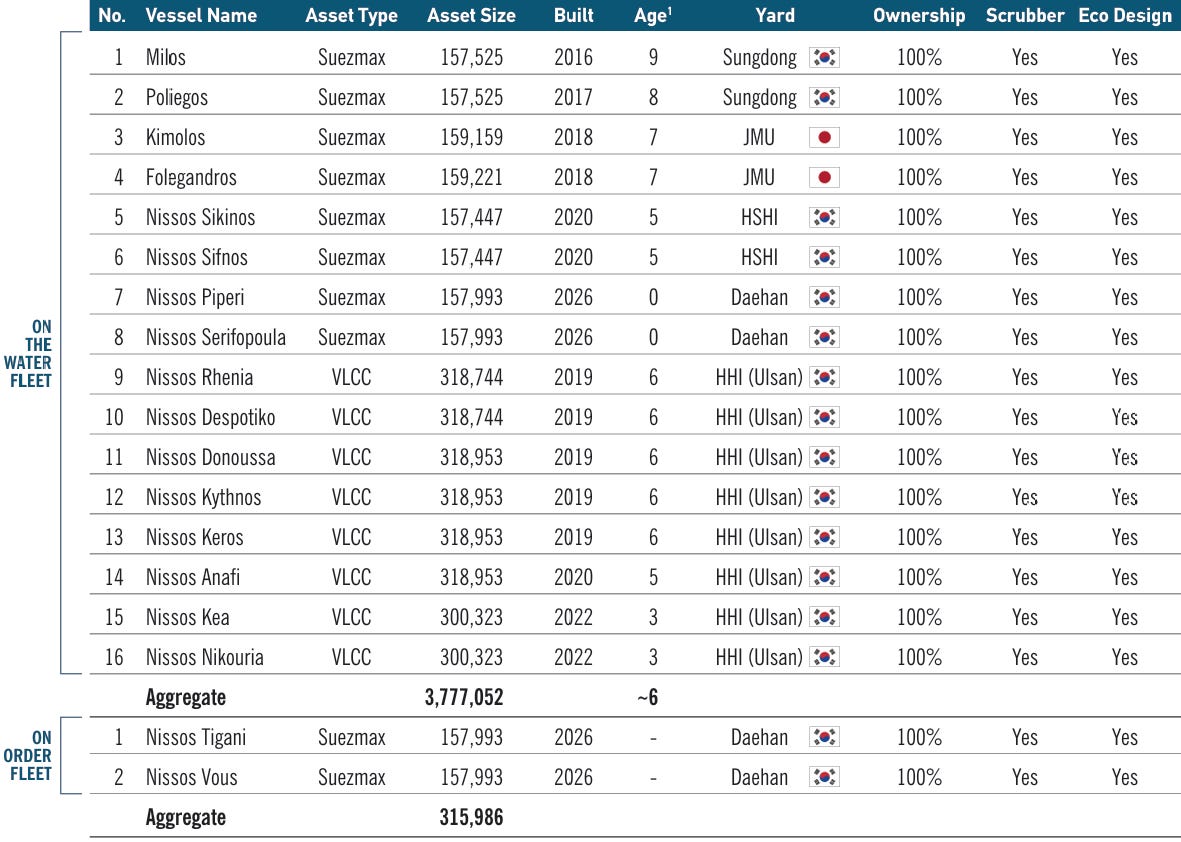
Okeanis Eco Tankers is a pure play crude tanker company with a young, fuel efficient fleet and a clear cash return profile. OET owns 16 large crude carriers, split between Suezmax vessels (medium sized crude tankers) and VLCCs (very large crude carriers), all built to eco standards and equipped with exhaust cleaning systems that allow them to burn cheaper fuel oil.
We see OET as a high quality crude tanker platform with a proven cash distribution track record and an attractive risk reward profile, supported by aligned family ownership and dual listings in Oslo and New York.
Investment Thesis
1. Premium Fleet Advantage
OET owns a young fleet of fuel-efficient Suezmax and VLCC tankers.
These ships burn less fuel than older vessels and use exhaust systems to run on cheaper fuel. In practice, this has translated into higher day rates than peers in recent years. We expect this gap to continue as long as the industry rewards newer, cleaner, and more efficient ships.
2. Proven Capital Returns
OET has already shown what it does with free cash. Since its IPO, the company has distributed over $550M in dividends, equal to ~2.5x its initial market cap.
This track record translates to a remarkable 13% average annualized dividend yield over the past sixteen quarters. Since its fleet became fully delivered, Okeanis has returned 91% of its reported net income to shareholders, proving its commitment to direct cash returns while tanker conditions remain healthy.
3. Aligned Insider Ownership
The controlling family, board members and key institutions all hold meaningful stakes and there are no options or other dilutive instruments.
This supports disciplined decisions on leverage, fleet risk and dividends. At the same time, a tight free float and the related party technical manager help explain why the stock can trade at a discount to our view of fair value.
We believe a company like OET, with its modern fleet, strong cash generation, and high payout policy, deserves a valuation at least in line with leading crude tanker peers as the current cycle continues through 2026.
Okeanis At a Glance
Okeanis Eco Tankers is a crude oil tanker company founded in 2018. It operates a fleet of 16 modern vessels, all equipped with scrubbers that allow the ships to burn cheaper fuel. That keeps operating costs low and gives OET a cost advantage over older, less efficient competitors.
Fleet Breakdown
The fleet is split into two asset classes:
8 VLCCs: Very Large Crude Carriers moving ~2M barrels per voyage.
8 Suezmax vessels: Tankers that typically carry 1M barrels of oil.
How the Fleet Creates Value
The company focuses entirely on two ship sizes: VLCCs for global trade and Suezmax vessels for regional flexibility. While competitors often manage mixed fleets of varying quality, OET owns a uniform collection of top tier ships delivered between 2016 and 2022. This discipline creates a pure operating platform with zero exposure to older, inefficient tonnage.
The business is built on two operational pillars:
Spot Market Strategy: Okeanis sells its shipping capacity at current daily market rates rather than locking in long term fixed prices. This ensures the company captures the full profit potential when global energy demand pushes freight rates higher.
The Scrubber Edge: Global regulations force most ships to burn expensive Low Sulfur Fuel Oil. Okeanis utilizes a cost saving alternative. Every vessel is equipped with a scrubber, an exhaust cleaning system that removes pollutants from the smoke. This allows the fleet to burn Heavy Fuel Oil. Since this unrefined fuel trades at a significant discount to the regulated low sulfur option, it secures a durable cost advantage on every voyage.
Tanker Fleet Profile
The fleet consists entirely of Eco vessels built by Hyundai Heavy Industries in Korea and Japan Marine in Japan. Because these builders are recognized as global leaders in ship quality, these vessels hold their value better and command higher prices in the secondhand market than ships from lower tier yards.
Exhibit: Okeanis Current Fleet
The business operates with high operating leverage. Daily costs covering crew, insurance, and interest remain fixed, while revenue fluctuates with the global oil market. Once daily rates cross the break even threshold, nearly every incremental dollar flows directly to profit. With the fleet fully delivered and zero capital for new construction, it directs FCF toward dividends and debt reduction.
Competitive Advantage: The Scrubber Premium
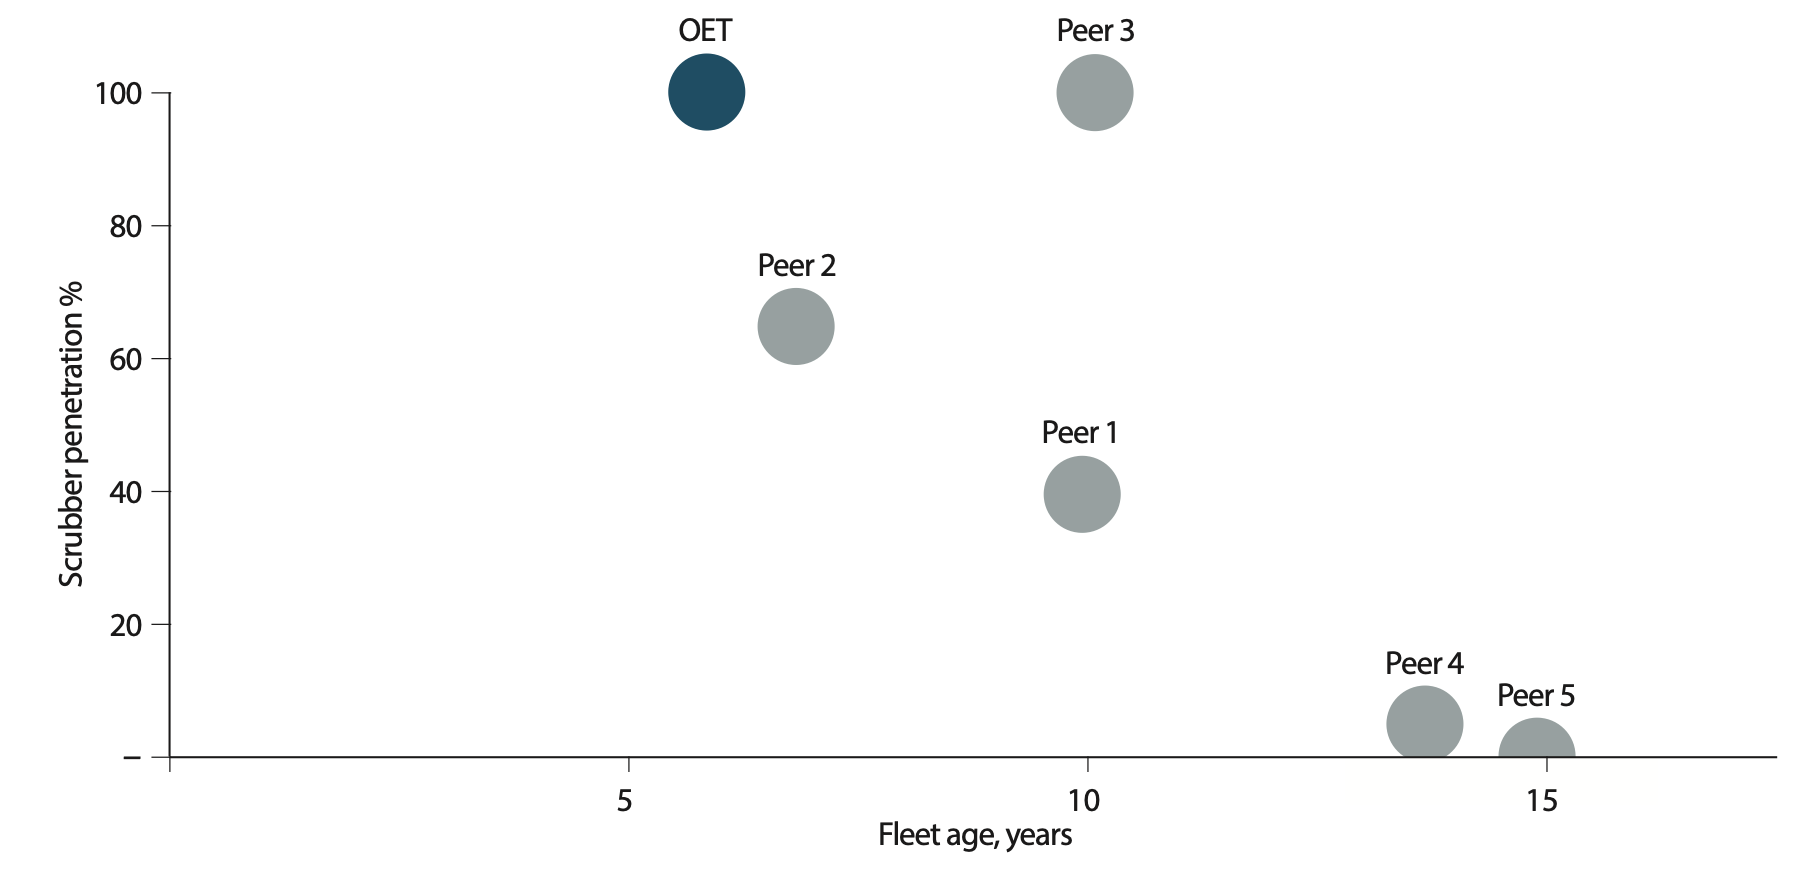
OET runs a modern, fuel-efficient fleet equipped entirely with scrubbers. This setup allows it to burn Heavy Fuel Oil at a much lower cost than low-sulfur fuel, driving a structural earnings premium through every market cycle. Since 4Q 2019, this edge has generated ~$256M in cumulative outperformance relative to peers.
The exhibit below shows exactly how OET stands apart. It operates one of the youngest fleets in the sector with 100% scrubber penetration, while peers rely on older vessels and much lower adoption rates. This combination allows OET to capture stronger charter rates while keeping daily operating costs low.
Exhibit: Scrubber Penetration vs Fleet Age
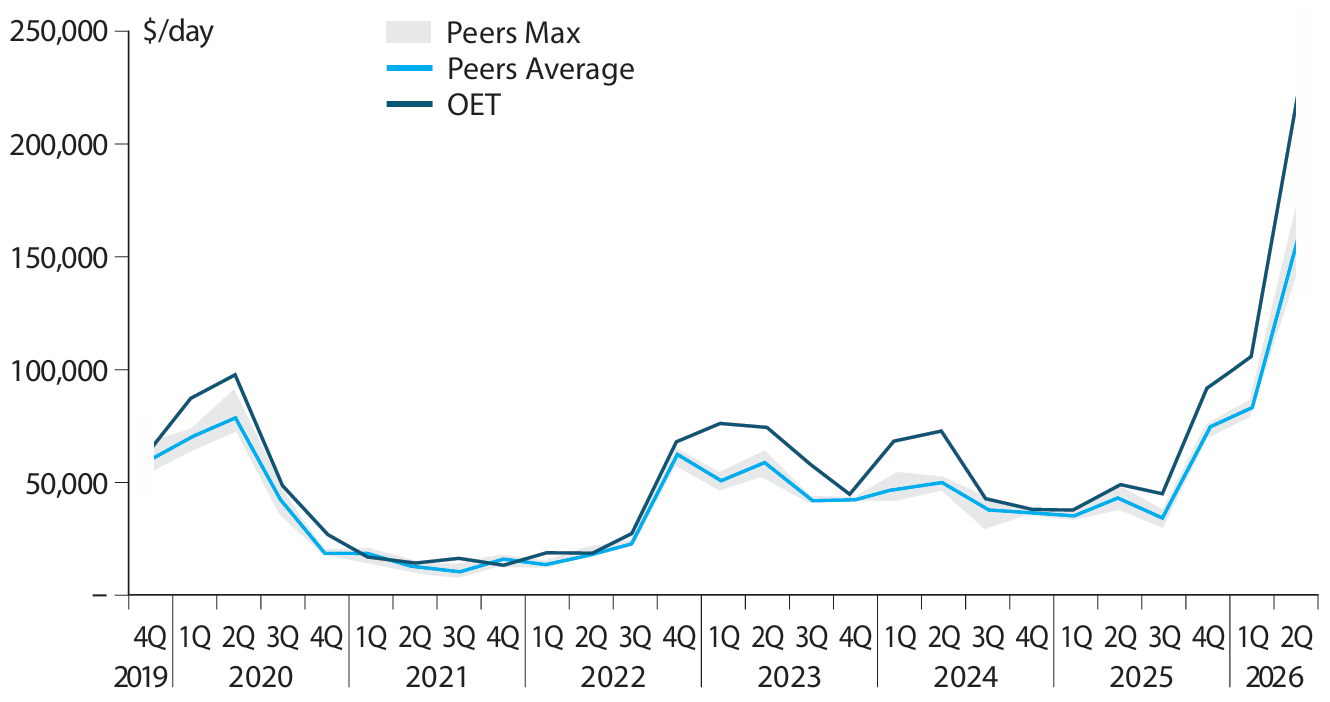
VLCC Segment Economics
OET’s 8 VLCCs focus entirely on high-volume trade routes from the Middle East to Asia. Because of their modern engine design, these tankers can run at higher speeds without triggering the severe fuel penalties that older ships face.
This capability allows OET to consistently outpace the market. Since late 2019, the VLCC fleet has locked in a steady $11,000 per day premium over peer averages, delivering $144M in cumulative outperformance.
Exhibit: VLCC Spot TCE Against Peers
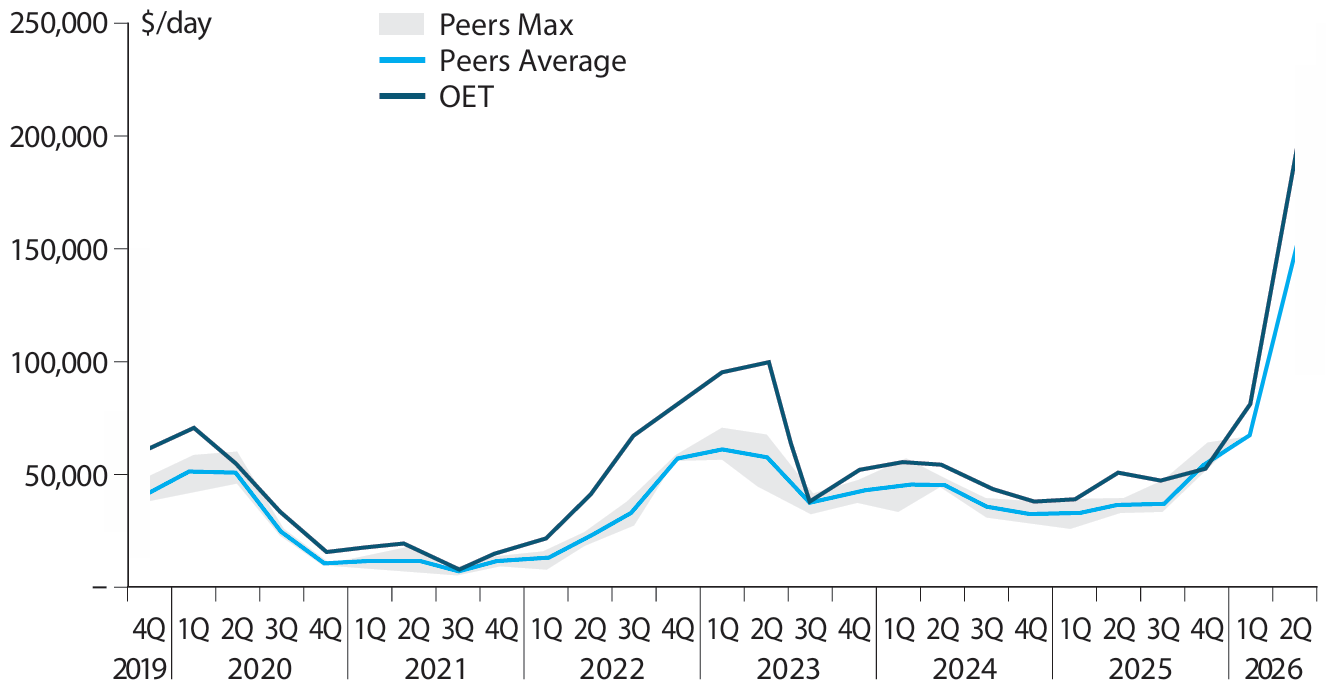
Suezmax Segment Economics
OET’s Suezmax fleet adds regional flexibility while matching the strong premiums of the VLCC segment. Low fuel consumption helps these vessels secure a steady $11,178 per day premium over peers, outperforming peers by $112M since late 2019. This cost advantage protects cash flow and keeps the fleet profitable even when rates dip and older vessels struggle to break even.
Exhibit: Suezmax Spot TCE Against Peers
Rate Setup & Bookings
OET Q1 just ended last week, and the company already enters 2Q26 with strong rate visibility. That is the beauty of shipping. A large share of available days is already fixed at firm levels, providing a clear line of sight on near-term earnings and reinforcing confidence in the upcoming quarters.
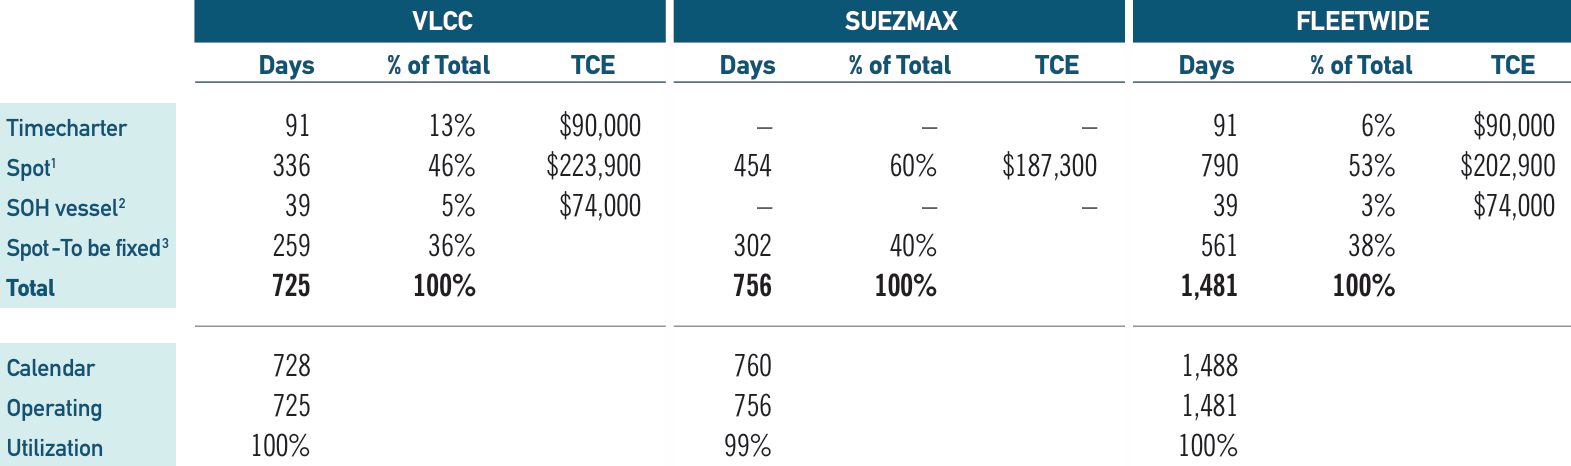
For 2Q26, the company already booked:
56% of VLCC days at $223,900/day
60% of Suezmax days at $187,300/day.
These realized and forward bookings establish the rate foundation of our model and highlight the fleet’s leverage to firm tanker conditions.
ECO Valuation & Estimates
The stock currently trades at 1.46x NAV. This is a slightly higher valuation compared to the end of 2025, but given the earnings growth and significant dividend yield, we believe it remains attractive.
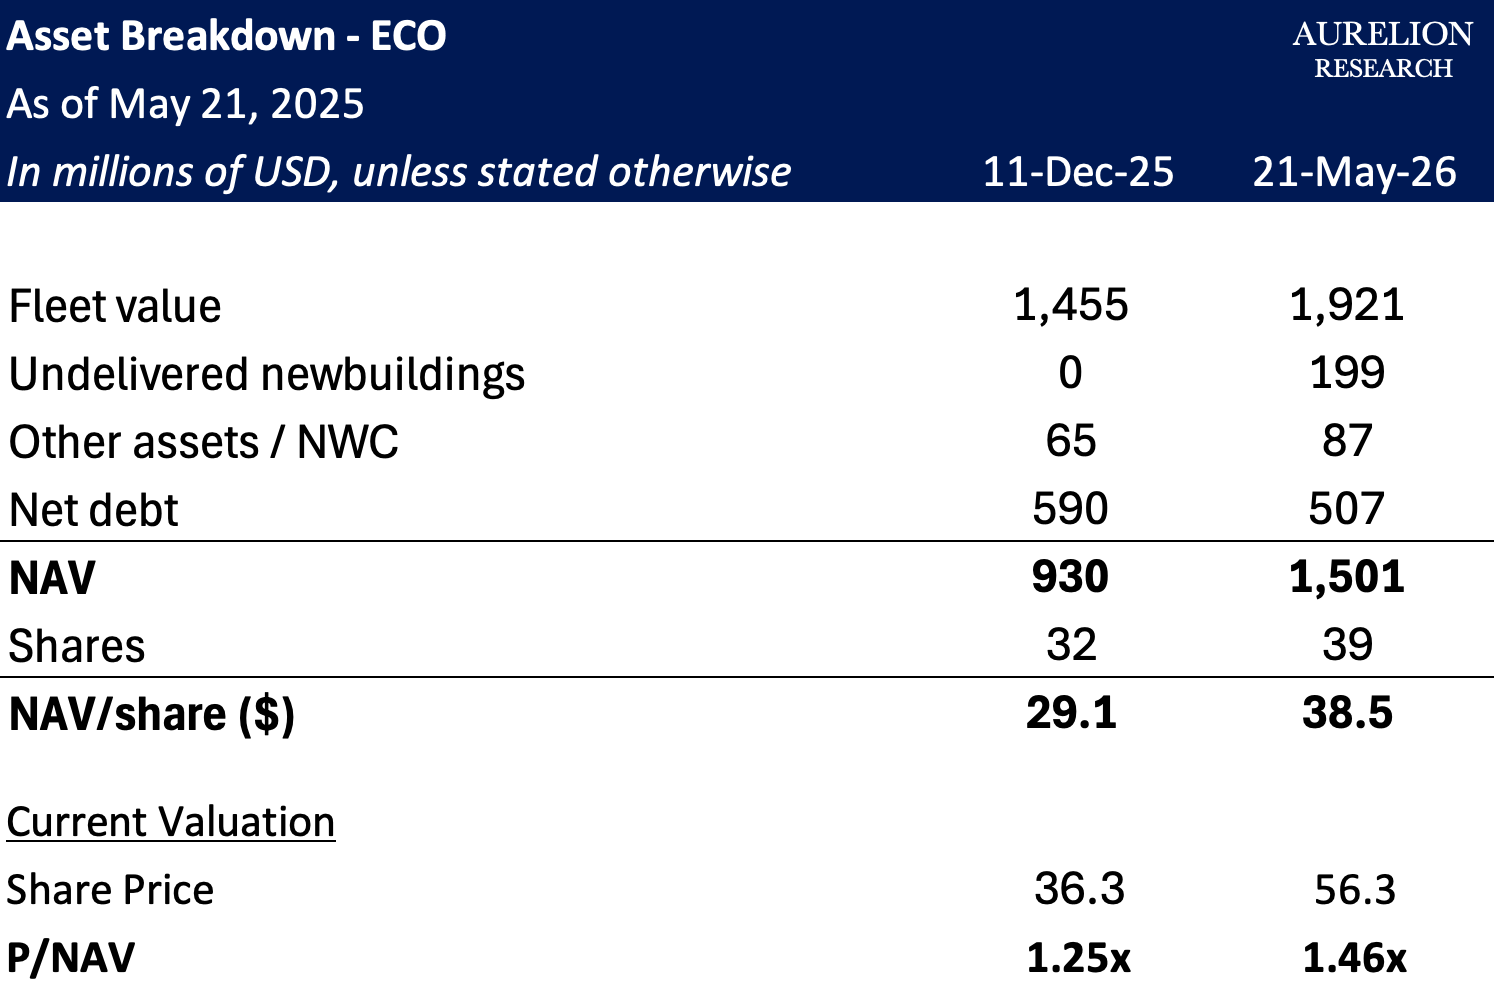
On earnings, we are forecasting TCE revenues of $610M in 2026, more than double the $265M generated in 2025. That flows through to net profit of $449M and adjusted EPS of $11.49. At a 90% payout ratio, total dividends per share are estimated at $10.34 for the year, a dividend yield of 18.3% at current prices.
For 2027, we expect some normalization as the rate environment moderates, with EPS at $7.93 and dividends at $7.14 per share, still implying a 12.7% yield.
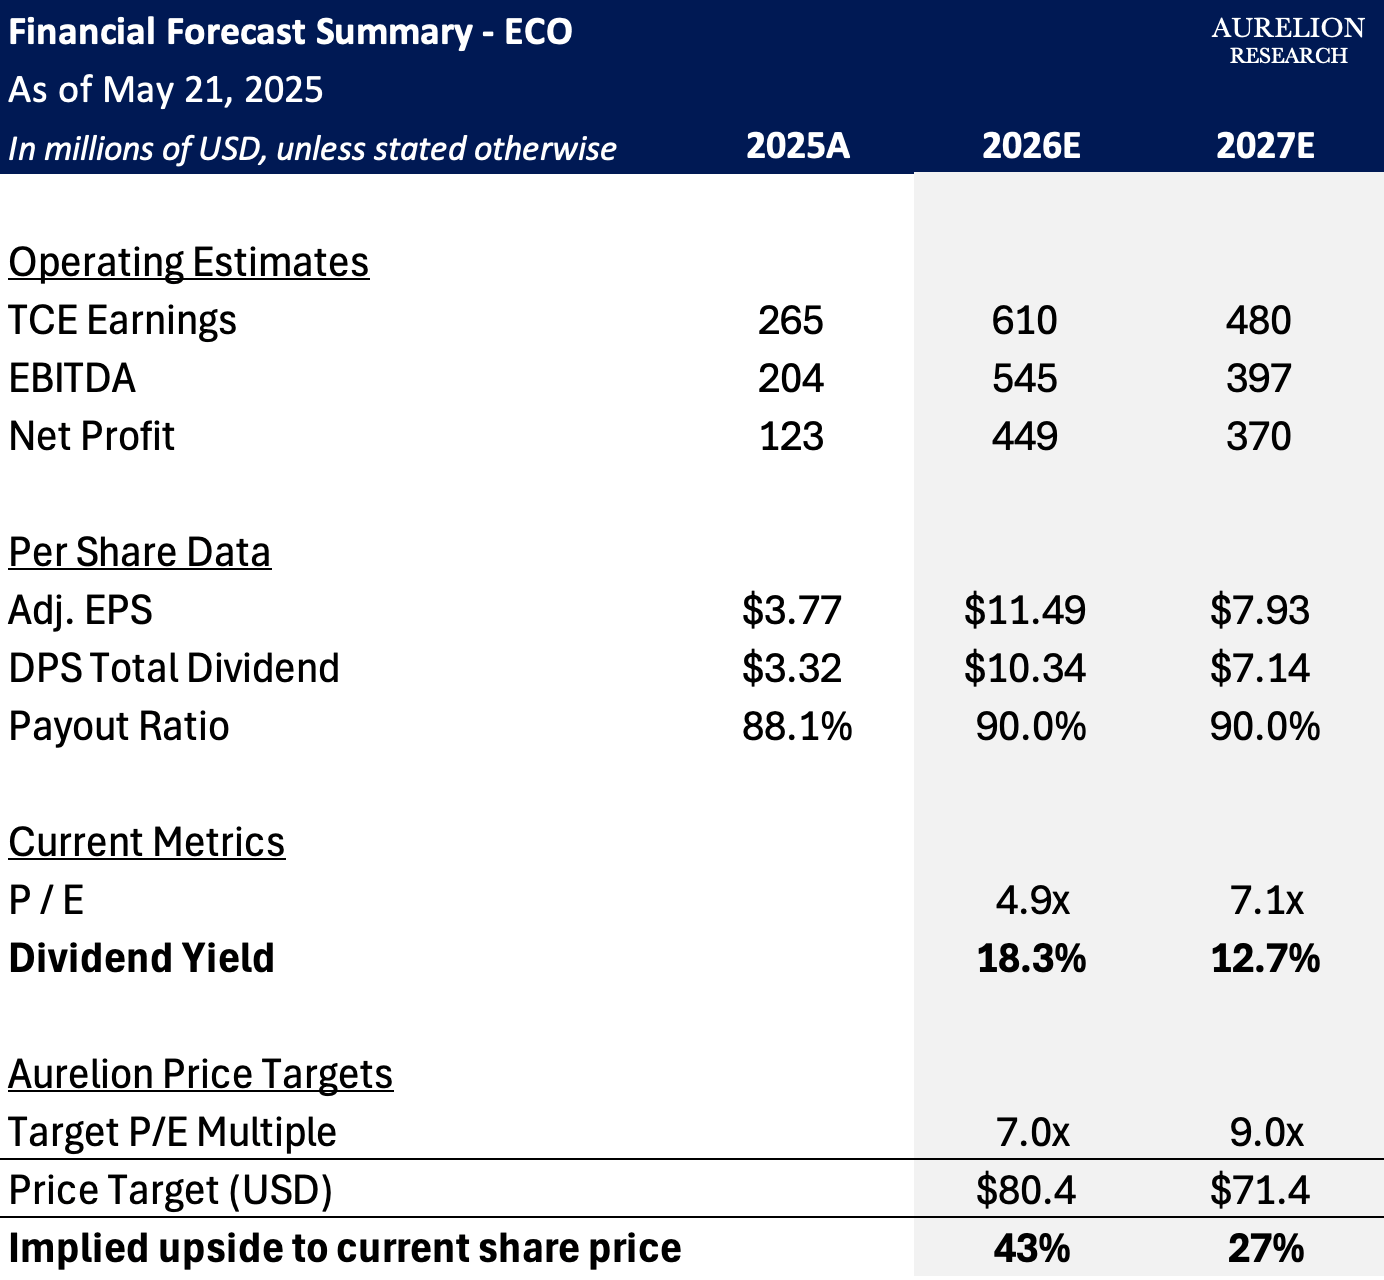
The stock trades at 4.9x our 2026 earnings estimate. Applying a 7.0x target multiple gives a price target of $80.4 per share, implying 43% upside. On 2027 at 9.0x, we arrive at $71.4, still 27% above current levels.
ECO was built to be among the lowest cost operators in the crude tanker market. Modern vessels, scrubbers, and fuel efficiency give it a margin advantage over older fleets that widens when rates are high. At a 90% payout ratio, shareholders capture most of that directly. Sell side estimates have moved sharply higher since Q1. We think there is still more to go.
8.2 Top Idea #2: TORM Shipping
We are adding back TORM Shipping (TRMD) to the Aurelion Index.
We published a full in depth report on TORM on January 20, 2026. If you have not read it yet, we recommend starting there as it covers the company in considerably more detail than the overview below.

TORM at a Glance
TORM is one of the world's largest pure-play product tanker companies, founded in 1889 and dual listed in the US and Denmark under the ticker TRMD. The fleet currently stands at 95 vessels, growing to 103 by 2028. Market cap sits at ~$3.35B.
The product tanker market continues to benefit from limited fleet growth and longer trade routes shaped by the Strait of Hormuz disruption.
TORM’s fleet mix gives it flexibility as cargo flows shift. Larger LR2 and LR1 vessels can focus on longer haul demand and switch into crude related trades when the economics work, while some MR vessels are chemical capable, expanding cargo options and keeping utilization stable.
Q1 2026 results were strong across the board.
Fleet-wide TCE rates averaged $34,937 per day, up significantly from $26,807 per day a year earlier. LR2 vessels were the standout at $41,062 per day, with LR1 at $34,903 per day and MR at $32,946 per day. Return on invested capital came in at 18% for the quarter, a level that reflects both the strength of the market and the quality of TORM's commercial execution
Key Drivers in 2026
The Strait of Hormuz closure changed everything for product tankers in 2026. Around 15% of global oil product flows were disrupted overnight, forcing a complete rerouting of refined product trade away from the Middle East and toward longer haul alternatives from the Atlantic Basin.
Atlantic Basin suppliers, primarily the US, Europe, and West Africa, are stepping in to replace Middle Eastern volumes, on voyages roughly double the normal length. That adds significant ton-miles per cargo and keeps ships busy for longer.
Russia related constraints continue to reshape trade flows. The EU ban on Russian crude-derived products has pushed Indian refined product exports into more complex routing, with some volumes ending up in floating storage rather than moving directly to buyers. That friction benefits compliant operators who can step in on longer haul replacement routes.
On supply, ~142 MR vessels are scheduled for delivery in 2026. The net impact on the clean tanker market is considerably smaller than that number suggests.
As MR vessels age past 20 years, their participation in clean trades drops sharply, from ~70% to ~40%. Once you account for that, the effective addition to the clean pool is closer to 86 vessels, around 40% less than the headline figure implies.
Demand for refined products has remained steady, with MR clean trade reaching a record 10.1M barrels per day in early 2026. That level of demand, combined with tight utilization and constrained effective supply, means the market does not need exceptional conditions to generate strong rates.
The question worth asking is how much of the current strength is tied to the disruption and how much reflects the underlying market. We think the aging fleet and the shift in refinery geography provide a solid foundation even without the Hormuz premium. We would not expect Q1 and Q2 rate levels to last forever, and anyone building a thesis on those numbers alone should factor that in.
TRMD Valuation & Estimates
Our financial model points to a compelling setup for TORM at current prices.
We are forecasting TCE earnings of $1,440M in 2026, up significantly from $910M in 2025, driven by the elevated rate environment. That translates into net profit of $655M and adjusted EPS of $6.48 for the year. At an 85% payout ratio, we estimate a total dividend per share of $5.51 in 2026, implying a dividend yield of 16.8% at current prices. For 2027, we expect some normalization as the Hormuz premium fades, with TCE earnings coming in at $1,350M and net profit at $578M, still generating $4.84 per share in dividends at a 14.7% yield.
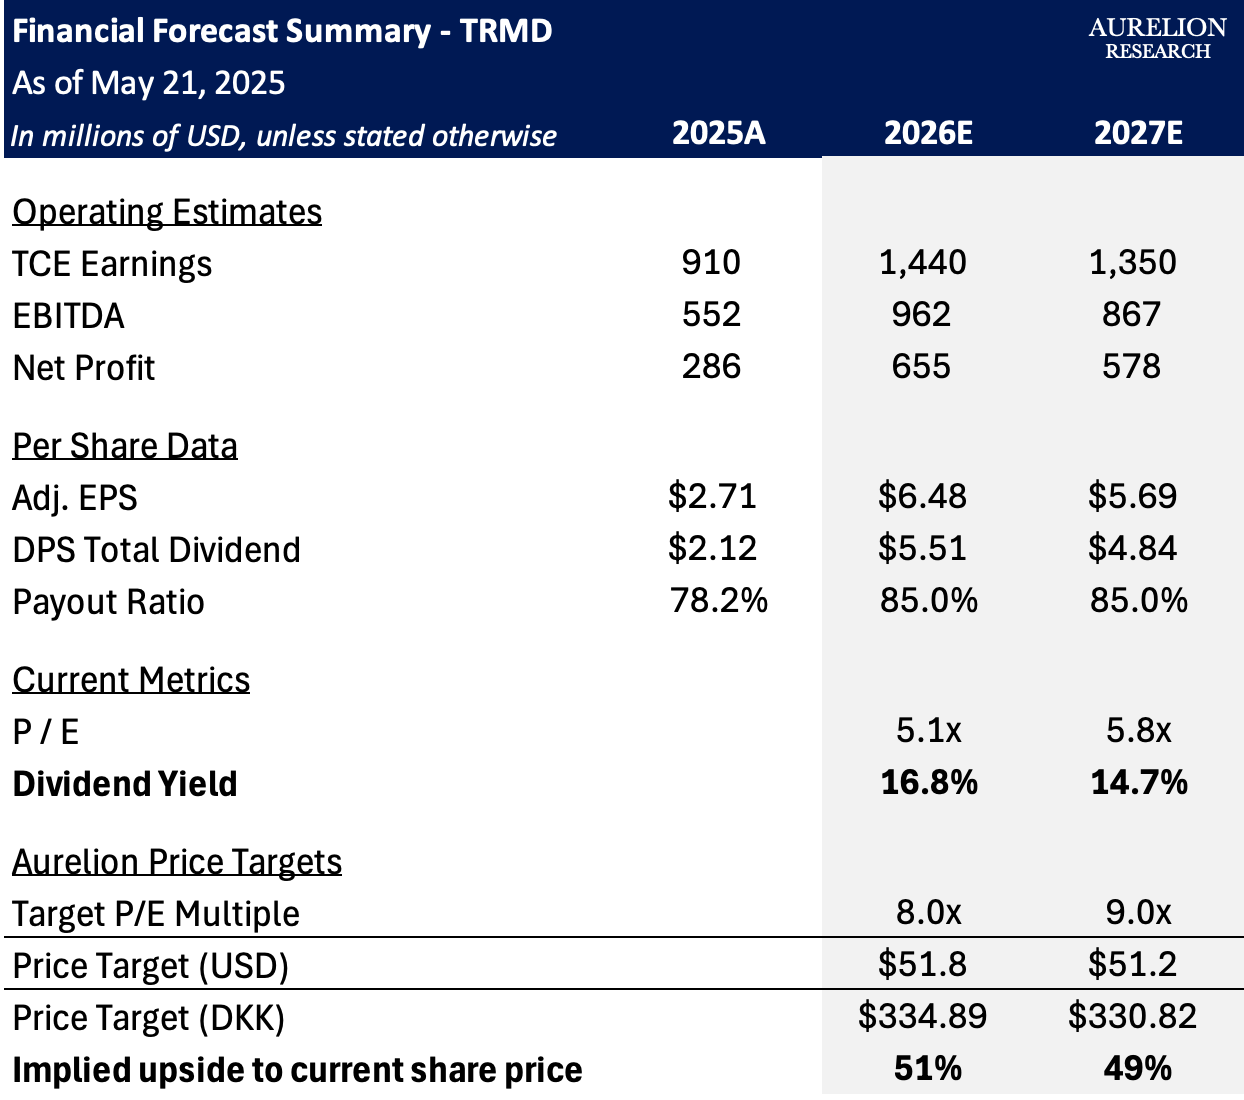
On valuation, the stock currently trades at 5.1x our 2026 earnings estimate and 5.8x our 2027E. Applying a target multiple of 8.0x to our 2026 EPS gives a Price Target of $51.8 per share, or DKK 334.89.On our 2027E at 9.0x, we arrive at $51.2 per share, or DKK 330.82. Both imply ~50% upside from current levels.
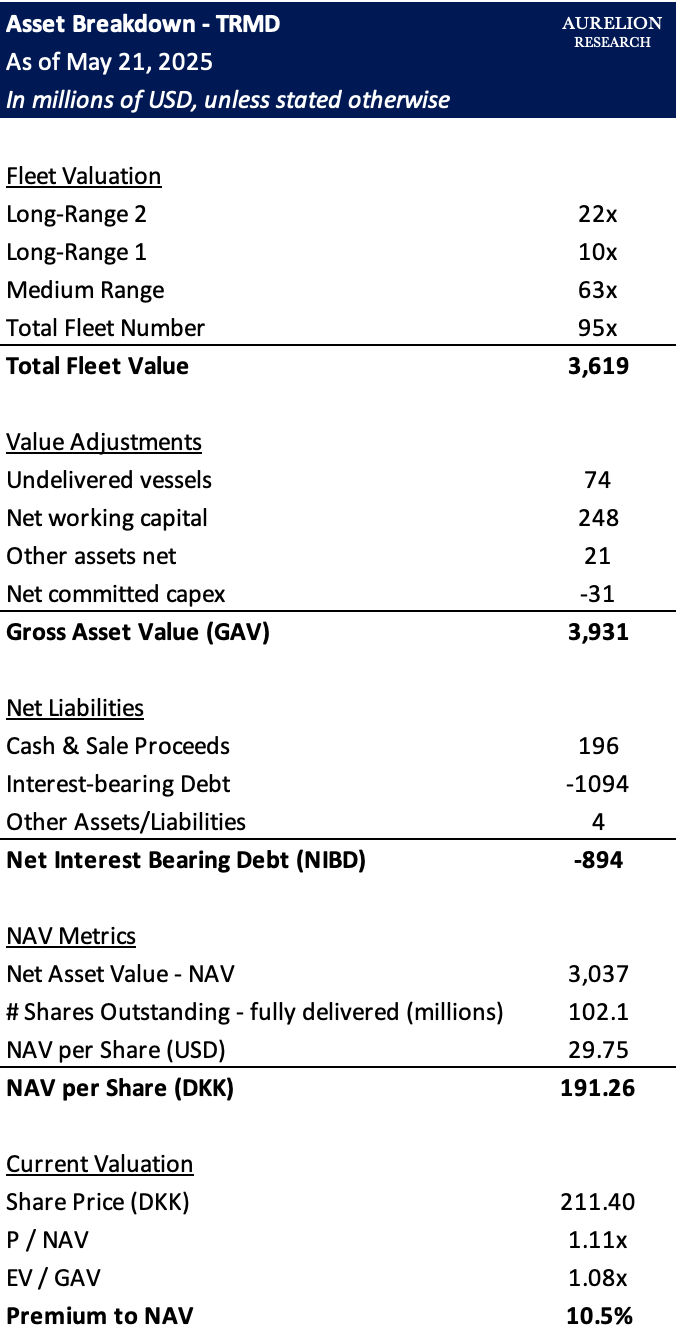
From a NAV perspective, the fleet is valued at $3,619M across 95 vessels, with a gross asset value of $3,931M after accounting for undelivered vessels, net working capital, and committed capex. After netting out debt, NAV per share comes to $29.75, or DKK 191.26. TRMD currently trades at 1.11x NAV, a modest premium that we think is more than justified given the earnings power at current rates.
It is worth noting that sell side estimates across the board have been revised sharply higher following the Strait of Hormuz closure and the Q1 2026 results.
Consensus has moved significantly in the direction of our numbers, and we think there is still room for further upward revisions as the full impact of the rate environment works its way through earnings.
9. Additional Stocks Worth Following
The two names we cover in depth in this report are our highest conviction ideas right now, but they are far from the only interesting opportunities in shipping.
We believe that each shipping segment has names worth following closely, and we will continue to flag them as the situation evolves through 2026.
9.1 Himalaya Shipping (Dry Bulk)
While we cannot include every company in the Aurelion Index, Himalaya Shipping (HSHP) is one we follow closely and think is worth highlighting.
The company owns 12 modern dual fuel dry bulk vessels, all delivered between 2023 and 2024, making it one of the youngest and most fuel efficient fleets in the Capesize market. That focus on modern tonnage is core to how it thinks about generating returns for shareholders, alongside a consistent monthly dividend.
Earnings Premium & Cash Breakeven
This modern fleet gives Himalaya a real earnings advantage.
Data from Fearnleys shows that Himalaya consistently outperforms both its peers and the standard market benchmarks. On average, the company secures a 48% premium over the Baltic 5TC index and a 25% premium over its direct competitors. Because these ships are so efficient, the company has a low daily cash breakeven of around $17,300 on a Capesize index equivalent basis.
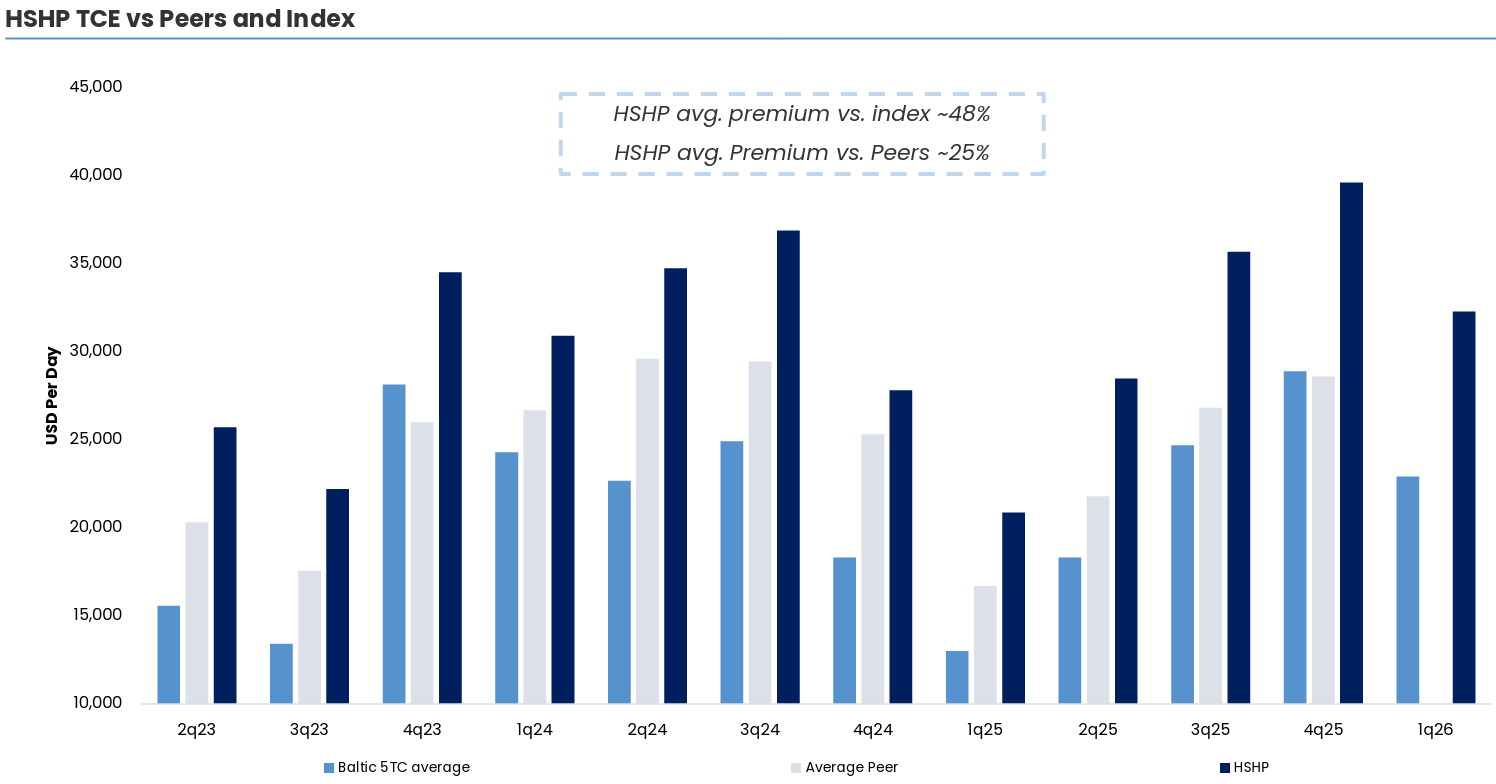
For context, the Baltic Capesize Index averaged $22,000 over the last five years. With a breakeven of $17,300, Himalaya generates positive cash flow even when rates are running below the historical average, which gives the company resilience through weaker parts of the cycle.
That cash flow has allowed them to pay 28 consecutive monthly cash distributions, including an 18 cent payout for the first quarter of 2026.
Operating Leverage & Dividend Capacity
We believe the real appeal of HSHP lies in its operating leverage when Capesize rates strengthen. Because their cash breakeven is set at $17,296, any increase in market rates drops straight to the bottom line as free cash flow to equity.
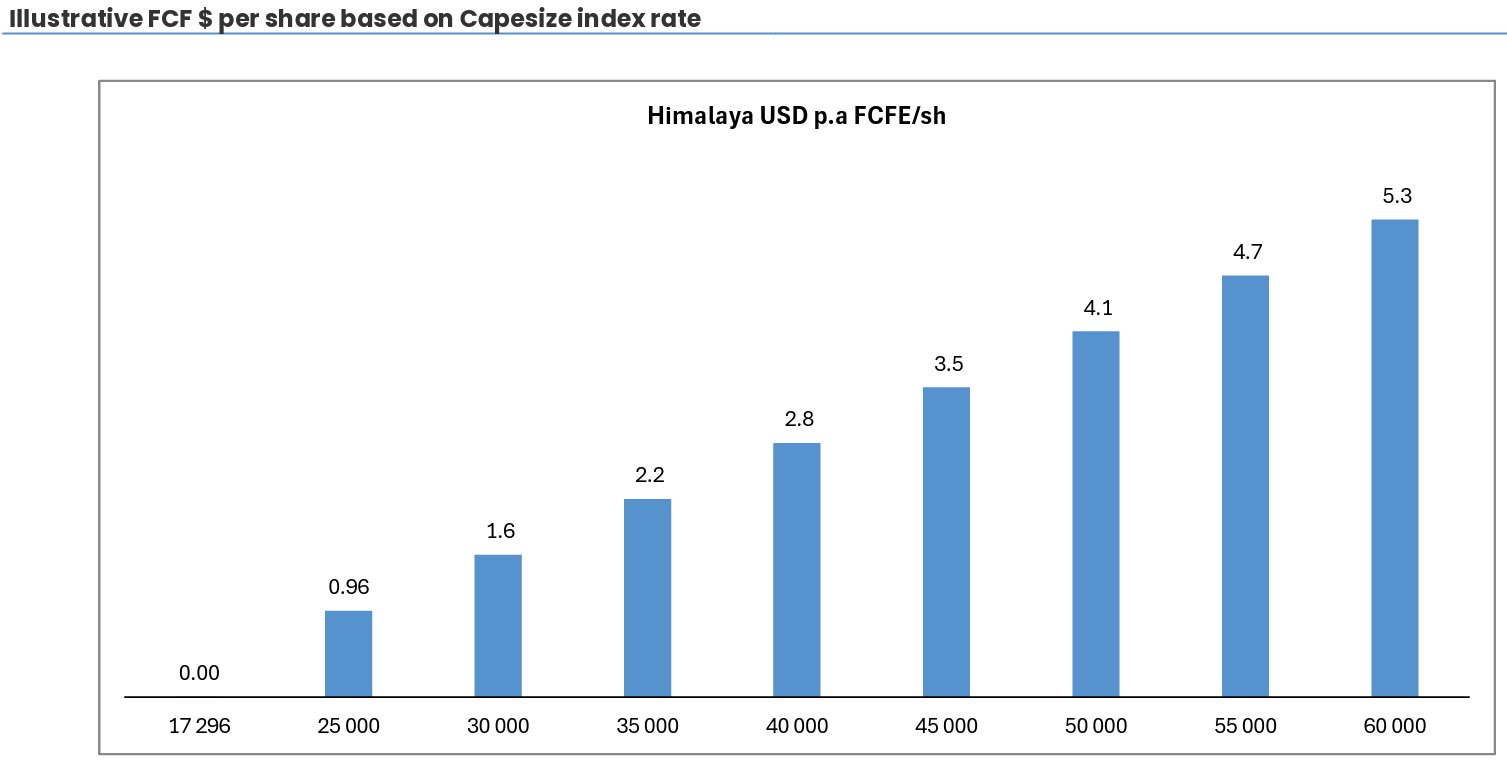
The company's rate sensitivity table shows exactly how this payout potential scales. If Capesize index rates rise to $30,000, free cash flow goes to $1.60 per share. At $45,000, it reaches $3.50, and if rates hit $60,000, the fleet can generate $5.30 per share annually. This direct link between market rates and cash generation makes the stock an effective way to capture dry bulk upside.
Balance Sheet & Alignment
On the balance sheet, Himalaya Shipping has a market cap of nearly $703M against $694M in gross debt. That breaks down to ~$58M per vessel, giving them an estimated loan to value ratio of 62%.
The financing carries a 7% fixed interest rate over a 7 year term, well within the 26 to 30 year useful life of these ships. Management and the board are also well aligned with shareholders, owning about one third of the equity.
9.2 Star Bulk Carriers (Dry Bulk)
Dry bulk remains our favorite segment within shipping for 2026. Star Bulk (SBLK) is a major global operator in this space, managing a large and diversified fleet of 145 owned vessels. Their fleet ranges from Supramax ships to large Newcastlemax carriers, giving them a total capacity of more than 14.0M DWT.
The average age of their ships is ~11.9 years. SBLK moves ~80M metric tons of cargo annually, carrying major commodities like iron ore, minerals, and grain, as well as minor bulks like bauxite, fertilizers, and steel products. They also operate a dedicated division in Singapore to connect cargo origins directly with end users.
Operating Leverage & Cash Flow Potential
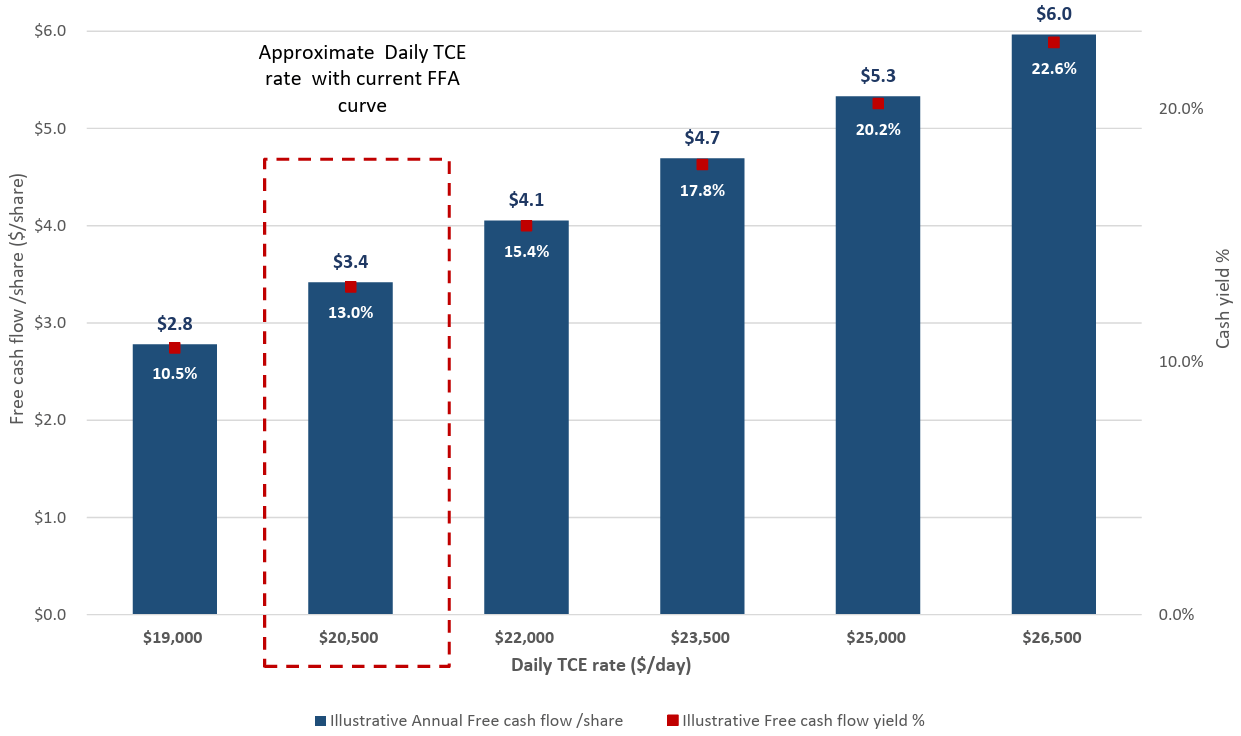
Star Bulk has high operating leverage, meaning that when daily charter rates move higher, the impact on cash flow is amplified quickly. At current market expectations of around $20,500 per day, the company is positioned to generate $3.40 of free cash flow per share, a 13.0% cash yield.
That number scales meaningfully with rates. At $19,000 per day, free cash flow holds at $2.80 per share, still a 10.5% yield. Push rates to $23,500 and free cash flow climbs to $4.70 per share at a 17.8% yield. At $26,500, the fleet generates $6.00 per share annually, a 22.6% cash yield. The upside sensitivity here is one of the most compelling aspects of the story.
Forward Free Cash Flow Yield at Various TCE Levels
Balance Sheet & Debt Reduction
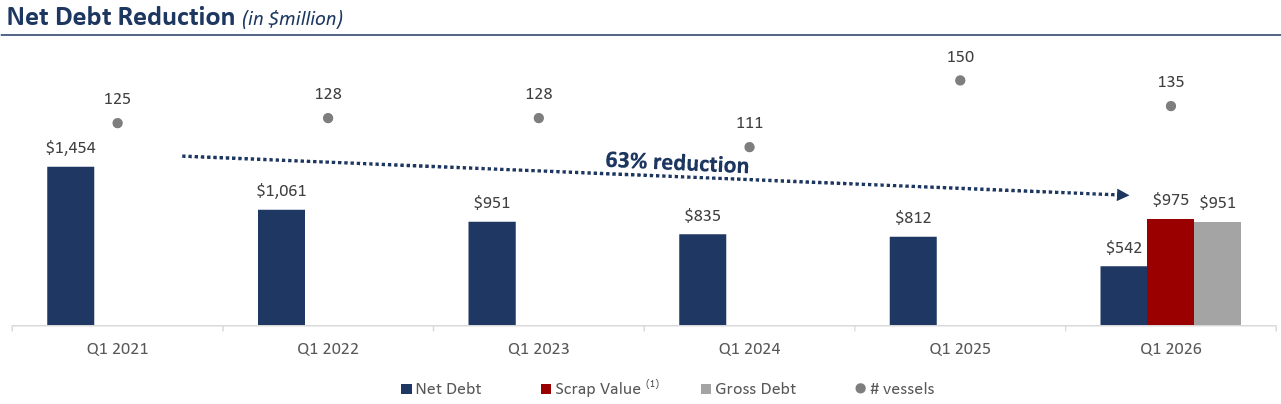
SBLK has aggressively cleaned up its balance sheet over the last few years. Since Q1 2021, it has reduced its net debt by 63%, dropping it from $1.454B down to $542M by Q1 2026. For context, their Q1 2026 gross debt sits at $951M, which is completely covered by the $975M scrap value of their fleet. Having a scrap value that is higher than their gross debt gives it a strong financial safety net.
Valuation & Outlook
We see clear upside to Star Bulk’s fundamental value. The company has a strong track record of solid execution, and as their cash flows grow, their dividend payouts are rising too. The stock still trades at a discount to its net asset value, and they operate in dry bulk, which is our favorite shipping segment for 2026. Given these factors, the current market valuation looks too conservative.
10. Our Final Take on the Shipping Market
Shipping is one of the most misunderstood industries in global markets, and that misunderstanding creates opportunity for those willing to do the work.
The Hormuz closure has accelerated trends that were already building, longer trade routes, tighter effective supply, and a growing divide between compliant operators and the shadow fleet. Those trends do not reverse overnight.
Our highest conviction call remains dry bulk, where valuations are attractive and the setup reminds us of crude oil tankers in 2025. Product tankers are generating strong earnings right now, and while some of that fades when the Strait reopens, the underlying market is in better shape than the orderbook alone would suggest.
Crude tankers have had their moment, and we think there is more to come as inventory rebuilding and sanction relief add volume back to the compliant market.
The market will keep moving, and so will we. We will continue to update our views as the geopolitical situation evolves and the data changes. In shipping, the picture can shift quickly, and staying close to it is what makes the difference.
Find how our stock portfolio is positioned here.
Our latest commodity deep-dive:

What you get as a paid subscriber:
~2 reports per week. Stock ideas, thematic research, commodity, and more.
Full access to our entire library of reports. Currently 100+ reports.
Live access to our actively managed portfolio: the Aurelion Index. All stocks are backed by in-depth research.
Access to our real-time trades & rationale. As a reminder, this is not investment advice, please conduct your own research.
Questions? Reach us directly on Substack or at contact@aurelionresearch.com.
The Aurelion Team
Disclosures & Methodology
Thank you for the research. Even a cursory glance tells me you spent a lot of time and work here. I sold TRMD quite recently. I'll be interested to revisit the thesis. Thanks again.
have you looked at NMM? stock sub $80 right now and trading at 0.5x NAV